


 FxWirePro- Major Crypto levels and bias summary
  FxWirePro: USD/CAD runs out of steam but maintains bullish outlook
  Bitcoin on Edge: Geopolitical Tensions Weigh on BTC as Bulls Eye the USD 64,000 "Buy the Dip" Zone
  FxWirePro- Major Crypto levels and bias summary
  NZDJPY Bears Take Control: New Zealand Dollar Retreats as 92 Resistance Holds Firm
  Ethereum Retreats Toward USD 2,000: Technicals Signal Caution as ETH Mimics Bitcoin’s Pullback
  Bitcoin Battles Volatility: Institutional Support Eyes USD 64,000 Floor Amid Geopolitical Tensions
  FxWirePro: GBP/NZD remains buoyant, looks to extend gains
  FxWirePro- Major Pair levels and bias summary
  Ethereum Reclaims $2,000 Handle: ETHUSD Stabilizes as Bulls Eye a Recovery
  Euro Retreats as Geopolitical Tensions Surge: EURUSD Eyes 1.1400 Floor Amid Safe-Haven Demand


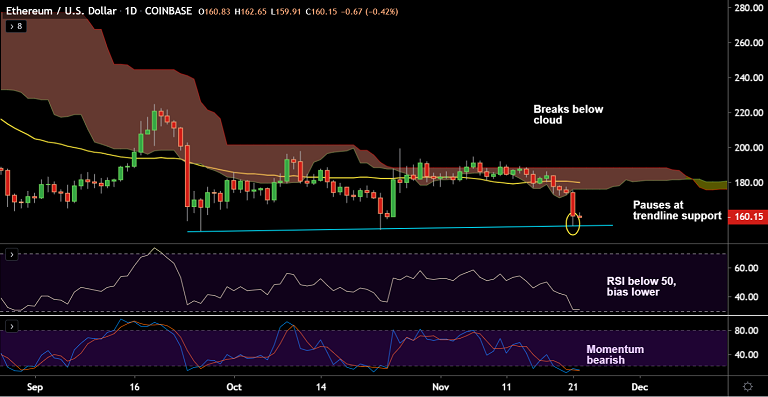
ETH/USD chart - Trading View
Exchange - Coinbase
Support: 155 (Trendline); Resistance: 169.66 (5-DMA)
Technical Analysis: Bias Bearish
ETH/USD is consolidating previous session's slump, bias strongly bearish.
The pair was trading at 159.56 at 05:50 GMT, down 0.83% at the time of writing.
Price action has shown a clear break below daily cloud raising scope for further weakness.
Downside has paused at strong trendline support at $155 mark, break below will see further weakness.
Technical indicators are biased lower, volatility is rising as evidenced by widening Bollinger bands.
However, oscillators are at oversold levels and price is extending below lower Bollinger band, some consolidation likely.
Break below trendline ($155) eyes next immediate support at 153 (Oct 23 low) ahead of 146 (Apr 25 low).


