


 Ethereum Trails Bitcoin’s Retreat: Key Support Levels in Focus
  FxWirePro- Major Pair levels and bias summary
  FxWirePro- Major European Indices
  FxWirePro: USD/ZAR loses momentum but outlook is bullish
  FxWirePro- Major Crypto levels and bias summary
  FxWirePro: USD/ZAR fibo rejection triggers sizeable pullback
  EUR/JPY Bulls Charge: Eyeing 186.00 as Euro Strength Intensifies
  AUDJPY Pullback Intensifies: Resistance at 110.00 Signals Short Opportunity
  Ethereum in Consolidation: ETH Trapped in Narrow Range as Bulls Await the USD 2,000 "Buy the Dip" Opportunity
  FxWirePro: USD/JPY neutral in the near-term, scope for downward resumption
  FxWirePro: NZD/USD cautiously bid as traders sense end to Iran war


 - EconoTimes)


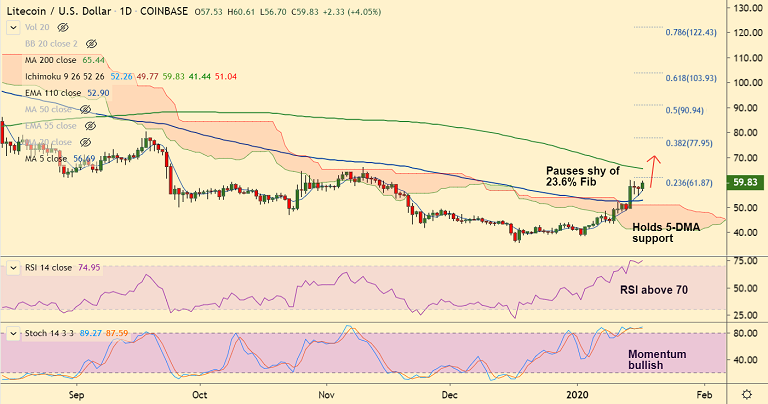
LTC/USD chart - Trading View
Exchange - Coinbase
Technical Analysis: Bias Bullish
GMMA Indicator: Major Trend - Turning slightly bullish; Minor Trend - Bullish
Overbought/ Oversold Index: Overbought
Volatility: High and rising (Bollibger Bands widen)
Support: 56.66 (5-DMA); Resistance: 61.87 (23.6% Fib)
LTC/USD has bounced off 5-DMA support with a 'Hammer' formation in the previous session.
The pair was trading 3.90% higher at 59.74 at around 06:30 GMT, bias remains bullish.
Technical studies support further gains in the pair. Price action has broken out of daily cloud.
Momentum studies are strongly bullish and volatility is high and rising. MACD and ADX support uptrend.
Upside in the pair pauses shy of 23.6% Fib at 61.87. Break above targets next major hurdle at 200-DMA at 65.43.
Break below 5-DMA support will see dip till 110-EMA at 52.89. Breach at 110-EMA negates near-term bullish bias.


