


 FxWirePro: GBP/USD outlook weaker on renewed downside pressure
  Ethereum Reclaims $2,000 Handle: ETHUSD Stabilizes as Bulls Eye a Recovery
  FxWirePro- Woodies Pivot(Major)
  FxWirePro- Major Crypto levels and bias summary
  FxWirePro: EUR/ NZD steadies around 2.0150, retains bid tone
  FxWirePro: AUD/USD downside pressure builds, key support level in focus
  Bitcoin Battles Volatility: Institutional Support Eyes USD 64,000 Floor Amid Geopolitical Tensions
  FxWirePro: EUR/AUD gaining momentum for a move towards 1.6800 level
  Bitcoin’s High-Stakes Volatility: BTCUSD Navigates Geopolitical Storms
  FxWirePro: USD/JPY firms as Trump's address on Gulf war spark fresh concerns
  Bitcoin Recovers Amid Easing Geopolitics: Bulls Target USD 80,000 Support Rebound


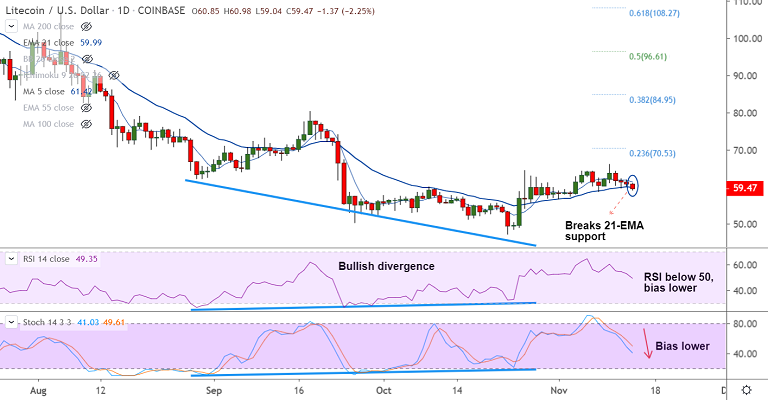
LTC/USD chart - Trading View
Exchange - Coinbase
Support: 57.28 (50-DMA); Resistance: 61.22 (55-EMA)
Technical Analysis: Bias bearish
LTC/USD was trading 2.04% lower on the day at 59.57 at 04:50 GMT, slightly above session lows at 59.04.
The pair has broken below 21-EMA support at 60.00 raising scope for further downside.
Technical indicators support weakness. Stochs and RSI are sharply lower and RSI has slipped below the 50 mark.
MACD is on verge of a bearish crossover on signal line.
Immediate support lies at 5W SMA at 59.29. Dip till 50-DMA at 57.28 likely. 'Bullish Divergence' may limit downside.
On the flipside, 55-EMA is major resistance at 61.22. Break above finds next resistance at 100-DMA at 65.05.


