


 Bitcoin Recovers Amid Easing Geopolitics: Bulls Target USD 80,000 Support Rebound
  FxWirePro: GBP/USD outlook weaker on renewed downside pressure
  FxWirePro- Major Crypto levels and bias summary
  FxWirePro: GBP/NZD remains buoyant, looks to extend gains
  Bitcoin on Edge: Geopolitical Tensions Weigh on BTC as Bulls Eye the USD 64,000 "Buy the Dip" Zone
  FxWirePro- Major European Indices
  FxWirePro- Woodies Pivot(Major)
  FxWirePro- Major Pair levels and bias summary
  FxWirePro- Major Pair levels and bias summary
  Bitcoin’s High-Stakes Volatility: BTCUSD Navigates Geopolitical Storms


 - EconoTimes)


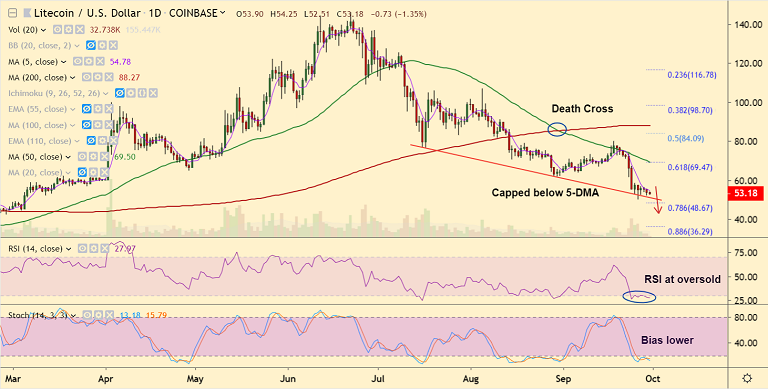
LTC/USD chart - Trading View
Exchange - Coinbase
Support: 50.25 (trendline); Resistance: 58.36 (200H SMA)
Technical Analysis: Bias turning slightly bullish
LTC/USD trades rangebound on the day, holds break above 5-DMA.
The pair has bounced off strong trend line support and RSI oscillator has shown a rollover from oversold zone.
Major trend in the pair is bearish and there is no change yet. Indicators are showing a slight shift in trend on the hourly charts.
200H SMA offers stiff resistance at 58.36. Breakout above could see more gains.
That said, 'Death Cross' on the daily charts to keep upside limited. Break above 200H SMA could see test of 21-EMA at 63.26.
5-DMA is immediate support at 55.64. Break below trendline support (50.25) to see more weakness.


