


 Ethereum Reclaims $2,000 Handle: ETHUSD Stabilizes as Bulls Eye a Recovery
  FxWirePro: GBP/NZD remains buoyant, looks to extend gains
  FxWirePro- Major Crypto levels and bias summary
  FxWirePro: USD/JPY firms as Trump's address on Gulf war spark fresh concerns
  Aussie Retreats Against the Yen: AUDJPY Bears Target 108 as 110 Resistance Holds Firm
  FxWirePro: AUD/USD downside pressure builds, key support level in focus
  FxWirePro: EUR/AUD eases slightly but trend is still bullish
  FxWirePro- Major European Indices
  Ethereum Retreats Toward USD 2,000: Technicals Signal Caution as ETH Mimics Bitcoin’s Pullback
  FxWirePro: USD/CNY gains some ground but bearish outlook persists
  FxWirePro: GBP/USD recovers but bears are not done yet again


 - EconoTimes)


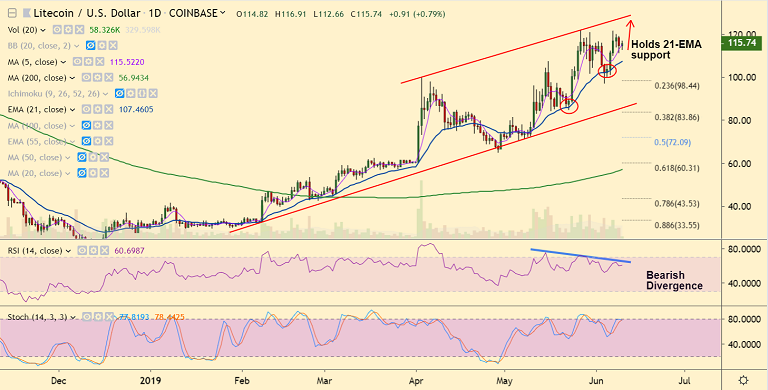
LTC/USD chart - Trading View
Exchange - Coinbase
Support: 107.45 (21-EMA); Resistance: 127 (trendline)
Technical Analysis: Bias Bullish
LTC/USD has resumed upside after a brief pause on June 9th trade, bias remains bullish.
The pair is extending consolidation above 21-EMA and we see weakness only on break below.
Pullback has held above 200H SMA and 5-DMA is still sharply higher.
'Cup and Handle' pattern seen on the daily charts. Price extends gains in accordance.
The pair is extending higher in a 'Rising Channel' pattern, scope for test of channel top at 127.
Back-to-back 'Spinning Top' and 'Doji' formations on weekly charts suggest some caution.
'Bearish Divergence' on RSI on the daily charts keeps upside limited. Further gains only on channel breakout.
Break below 21-EMA will see resumption of weakness. Immediate support is seen at 23.6% Fib at 98.44.
For details on FxWirePro's Currency Strength Index, visit http://www.fxwirepro.com/currencyindex.


