


 Aussie Retreats Against the Yen: AUDJPY Bears Target 108 as 110 Resistance Holds Firm
  FxWirePro: GBP/NZD range to extend until there is game changing news
  FxWirePro: GBP/USD outlook weaker on renewed downside pressure
  Ethereum in Consolidation: ETH Trapped in Narrow Range as Bulls Await the USD 2,000 "Buy the Dip" Opportunity
  FxWirePro- Major Crypto levels and bias summary
  Bitcoin on Edge: Geopolitical Tensions Weigh on BTC as Bulls Eye the USD 64,000 "Buy the Dip" Zone
  FxWirePro: EUR/AUD gaining momentum for a move towards 1.6800 level
  FxWirePro:NZD/USD drifts lower, could be on verge of bigger drop
  FxWirePro: USD/ZAR fibo rejection triggers sizeable pullback
  EUR/JPY Bulls Charge: Eyeing 186.00 as Euro Strength Intensifies
  FxWirePro- Major Crypto levels and bias summary
  Bitcoin Battles Volatility: Institutional Support Eyes USD 64,000 Floor Amid Geopolitical Tensions


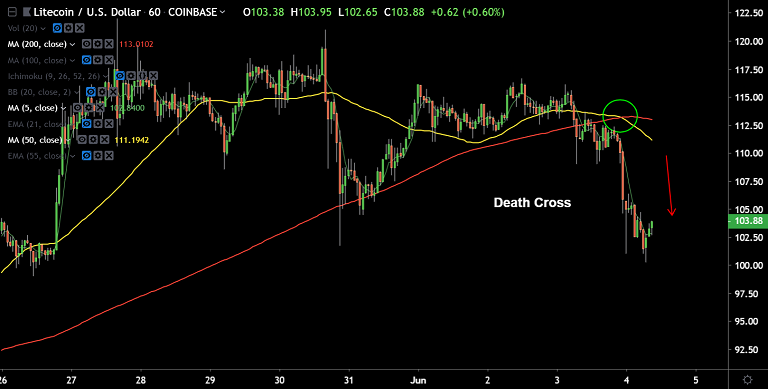
LTC/USD chart - Trading View
Exchange - Coinbase
Support: 98.44 (23.6% Fib); Resistance: 110.57 (5-DMA)
Technical Analysis: Bias Bearish
LTC/USD tests 21-EMA, hits 2-week lows at 100.25 before paring some losses.
Doji formation on the previous weeks candle raises scope for downside.
Stochs and RSI have rolled over from overbought levels, bias lower.
MACD is showing a bearish crossover on signal line. -ve DMI crossover on +ve DMI.
'Death Cross' formation on the hourly charts adds to the bearish bias.
Close below 21-EMA will see dip till 83.10 (channel base). Failure to close below 21-EMA will see consolidation.
For details on FxWirePro's Currency Strength Index, visit http://www.fxwirepro.com/currencyindex.


