


 FxWirePro- Woodies Pivot(Major)
  FxWirePro- Major Pair levels and bias summary
  Pound Under Pressure as Yen Stabilizes: GBPJPY Bears Target 208 as Key EMAs Hold Resistance
  FxWirePro: GBP/NZD remains buoyant, looks to extend gains
  NZDJPY Bears Take Control: New Zealand Dollar Retreats as 92 Resistance Holds Firm
  FxWirePro: EUR/ NZD steadies around 2.0150, retains bid tone
  FxWirePro: EUR/AUD eases slightly but trend is still bullish
  Ethereum Retreats Toward USD 2,000: Technicals Signal Caution as ETH Mimics Bitcoin’s Pullback
  FxWirePro: USD/ZAR fibo rejection triggers sizeable pullback
  FxWirePro:NZD/USD drifts lower, could be on verge of bigger drop
  Bitcoin’s High-Stakes Volatility: BTCUSD Navigates Geopolitical Storms


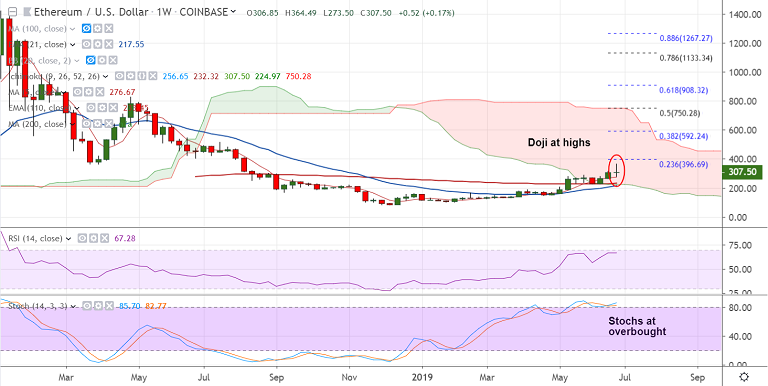
ETH/USD chart - Trading View
Exchange - Coinbase
Support: 279.89 (20-DMA) ; Resistance: 312.60 (5-DMA)
Technical Analysis: Major trend - Bullish; Minor trend - Turning Slightly Bearish
ETH/USD was trading 4.65% higher on the day at 307.60 at 10:00 GMT.
The pair edges higher from weekly lows at 273.50, finds strong support at 20-DMA.
Major trend in the pair is bullish. GMMA has shown a shift in trend to bullish on the daily charts.
On the daily charts, oscillators have approached overbought levels and are on verge of rollover into neutral territory.
Price action has broken below 5-DMA and Stochastics RSI is showing rollover from overbought levels.
A potential 'Shooting Star' formation on the weekly charts raises scope for weakness.
Further, bearish divergence on RSI and Stochs on the daily charts adds to the bearish bias.
The pair finds strong support at 20-DMA at 280, break below will see weakness till 55-EMA at 252
For details on FxWirePro's Currency Strength Index, visit http://www.fxwirepro.com/currencyindex.


