


 FxWirePro- Major Pair levels and bias summary
  Ethereum Retreats Toward USD 2,000: Technicals Signal Caution as ETH Mimics Bitcoin’s Pullback
  FxWirePro: GBP/USD outlook weaker on renewed downside pressure
  FxWirePro: AUD/USD downside pressure builds, key support level in focus
  FxWirePro: GBP/NZD range to extend until there is game changing news
  FxWirePro- Major Pair levels and bias summary
  FxWirePro: USD/CNY gains some ground but bearish outlook persists
  Bitcoin Battles Volatility: Institutional Support Eyes USD 64,000 Floor Amid Geopolitical Tensions
  FxWirePro: USD/JPY firms as Trump's address on Gulf war spark fresh concerns
  Bitcoin’s High-Stakes Volatility: BTCUSD Navigates Geopolitical Storms
  Aussie Retreats Against the Yen: AUDJPY Bears Target 108 as 110 Resistance Holds Firm
  FxWirePro- Major Crypto levels and bias summary


 shows minor retracement from 12-week high (0.0230), 200-DMA offers stiff resistance - EconoTimes)


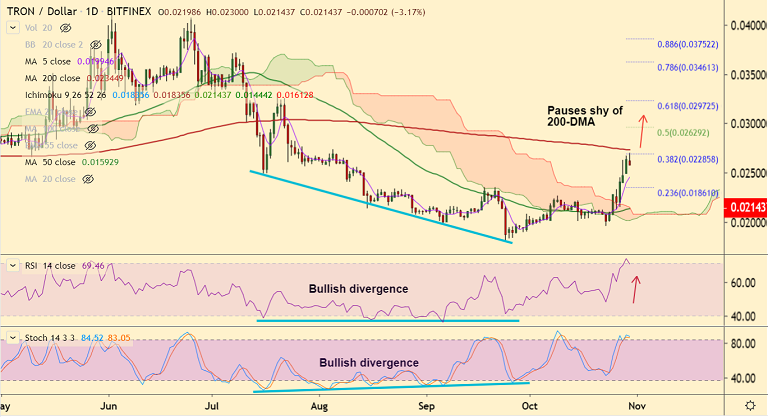
TRX/USD chart - Trading View
Exchange - Bitfinex
Support: 0.019946 (5-DMA); Resistance: 0.02345 (200-DMA)
Technical Analysis: Bias bullish
TRX/USD has paused bullish run just short of 200-DMA resistance at 0.023449.
The pair hit new 12-week highs at 0.0230 before paring some gains to trade at 0.021437 at 05:20 GMT.
GMMA shows shift in near-term bias to bullish. The short-term MAs have shown a break above long-term MAs.
Breakout above 110-EMA and daily cloud further strengthens bullish bias. Volatility is also rising on the daily charts.
200-DMA offers stiff resistance. Some consolidation at current levels likely. Break above 200-DMA will see upside resumption.
Next bull target lies at 55W EMA at 0.025639 ahead of 50% Fib retracement at 0.026292.
Immediate support lies at 5-DMA at 0.019946. Retrace below 110-EMA and daily cloud negates bullish bias.


