


 Bitcoin Recovers Amid Easing Geopolitics: Bulls Target USD 80,000 Support Rebound
  FxWirePro- Major Crypto levels and bias summary
  FxWirePro- Major Crypto levels and bias summary
  FxWirePro: USD/CAD runs out of steam but maintains bullish outlook
  FxWirePro: GBP/USD recovers but bears are not done yet again
  FxWirePro: USD/ZAR fibo rejection triggers sizeable pullback
  Bitcoin on Edge: Geopolitical Tensions Weigh on BTC as Bulls Eye the USD 64,000 "Buy the Dip" Zone
  FxWirePro- Major European Indices
  FxWirePro: USD/JPY firms as Trump's address on Gulf war spark fresh concerns
  Ethereum Reclaims $2,000 Handle: ETHUSD Stabilizes as Bulls Eye a Recovery
  Bitcoin’s High-Stakes Volatility: BTCUSD Navigates Geopolitical Storms
  FxWirePro: EUR/AUD eases slightly but trend is still bullish


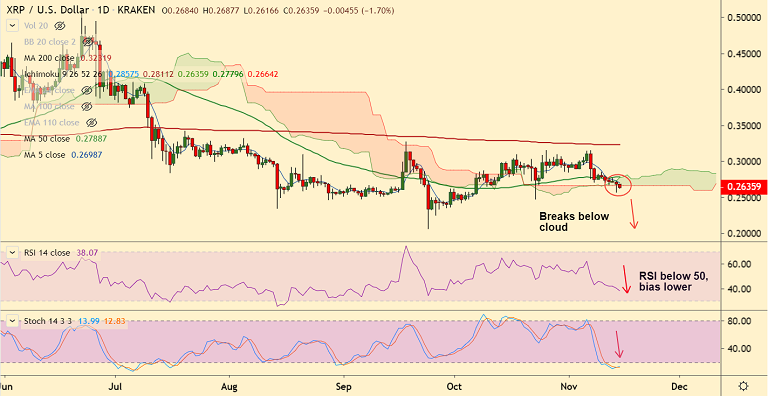
XRP/USD chart - Trading View
Exchange - Kraken
Support: 0.2472 (Oct 21 low); Resistance: 0.2745 (100-DMA)
Technical Analysis: Bias Strongly Bearish
XRP/USD is extending weakness for the 6th straight session, bias strongly bearish.
The pair was trading 1.74% lower at 0.2634 at 06:45 GMT after closing 1.31% lower in the previous session.
Price action has slipped below daily cloud raising scope for further weakness.
Technical indicators have turned bearish. Stochs and RSI are sharply lower and RSI is well below 50 mark.
Volatility is rising. MACD and ADX support weakness. GMMA indicator shows bearish shift in short-term trend.
Next supports on the downside lies at 0.2472 (Oct 21 low) ahead of lower weekly Bollinger band at 0.2203.
5-DMA is immediate resistance at 0.2698, break above will see gains till 55-EMA at 0.2820.


