


 Ethereum Reclaims $2,000 Handle: ETHUSD Stabilizes as Bulls Eye a Recovery
  FxWirePro: GBP/USD recovers but bears are not done yet again
  Euro Retreats as Geopolitical Tensions Surge: EURUSD Eyes 1.1400 Floor Amid Safe-Haven Demand
  NZDJPY Bears Take Control: New Zealand Dollar Retreats as 92 Resistance Holds Firm
  Bitcoin’s High-Stakes Volatility: BTCUSD Navigates Geopolitical Storms
  Aussie Retreats Against the Yen: AUDJPY Bears Target 108 as 110 Resistance Holds Firm
  FxWirePro: GBP/USD outlook weaker on renewed downside pressure
  Bitcoin Recovers Amid Easing Geopolitics: Bulls Target USD 80,000 Support Rebound
  FxWirePro- Major Crypto levels and bias summary
  FxWirePro: EUR/AUD gaining momentum for a move towards 1.6800 level
  FxWirePro- Major Crypto levels and bias summary


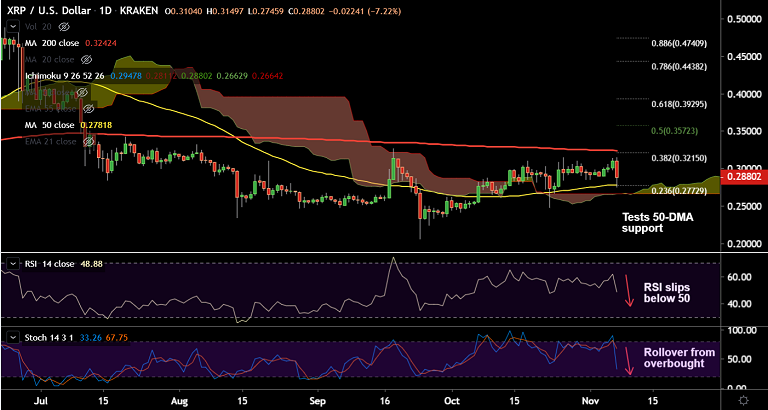
XRP/USD chart - Trading View
Exchange - Kraken
Support: 0.2781 (50-DMA); Resistance: 0.3242 (200-DMA)
Technical Analysis: Bias turning bearish
XRP/USD has slumped over 9% on the day to hit 2-week lows at 0.2745.
The pair has erased some losses and was trading at 0.2879, down 7.24% at 11:55 GMT.
A 'Bearish Engulfing' pattern on the daily charts has raised scope for weakness.
Technical studies on the daily charts are turning bearish. Stochs and RSI have turned lower, RSI has slipped below 50.
Price action has been struggling to break above 21W EMA from the past 4 weeks.


