


 FxWirePro- Major Crypto levels and bias summary
  FxWirePro- Major Crypto levels and bias summary


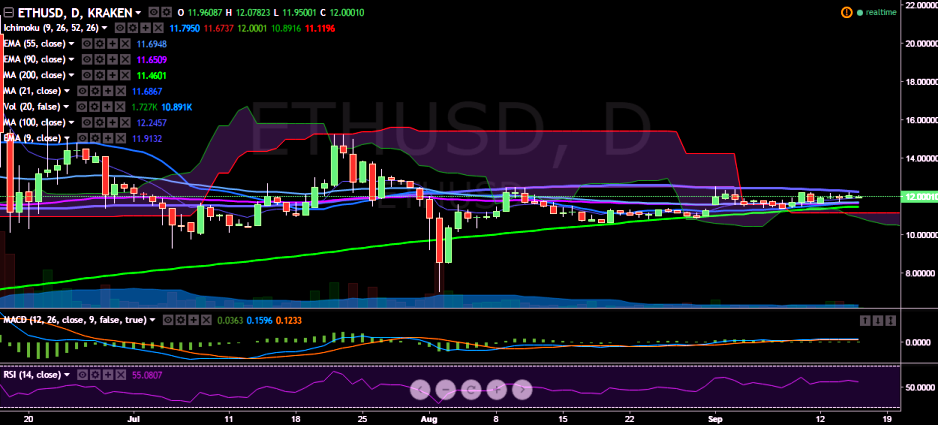
ETH/USD is once again showing a slight dip after it faced resistance at 100-DMA. It hit 12.22 levels on Thursday and is currently trading at 12.00 levels (Kraken).
Long-term trend: Bullish
Short-term trend: Bullish
Ichimoku analysis of daily chart:
Tenkan Sen: 11.79
Kijun Sen: 11.60
Trend reversal: 11.64 (90 EMA)
The pair seems to be struggling to close above 12.27 (100-day MA). Only a close above 12.54 levels (September 01 high) would see a further jump till 13.27 (161.8% retracement of 12.54 and 11.35)/15.23 (July 22 high).
On the other side, 9-EMA is acting like a minor support for the pair. A break below would see a dip till 11.64 (90 EMA)/ 11.43 (200-day MA)/10.00 (psychological level).

- News

- Economy

- Central Banks
- Investing
- Research
- Roundups
- Digital Currency
- Insights
- Technical Analysis
- Technology
- Business
- Law
- Health
- Nature
- Fintech
- Science
- Topic
- Opinions
- ©Econometrics LLC . All Rights Reserved.
ETH/USD faces strong resistance at 100-DMA, bullishness only above 12.54
Friday, September 16, 2016 10:29 AM UTC
Editor's Picks


- Market Data
Most Popular


7


