


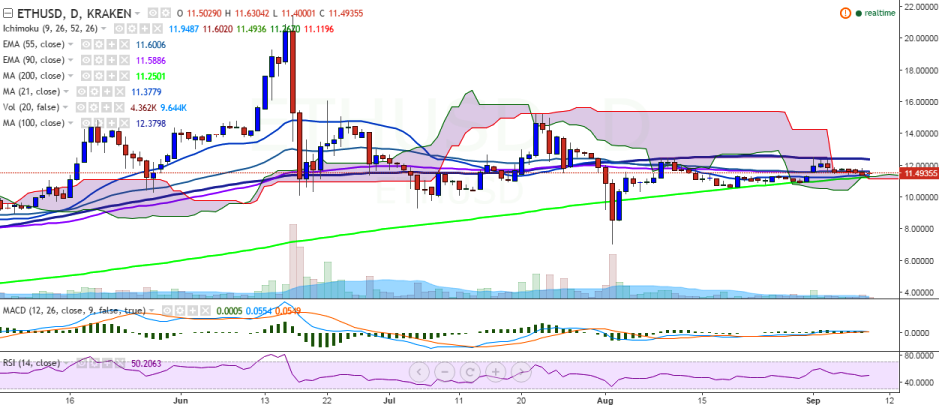
ETH/USD hit fresh low of 11.35 levels on Thursday, closing just shy of 21-day MA. It is currently trading at 11.49 levels and faces strong resistance at 90-EMA (Kraken).
Long-term trend: Bullish
Ichimoku analysis of daily chart:
Tenkan Sen: 11.75
Kijun Sen: 11.60
Trend reversal: 11.59 (90 EMA)
“The pair has taken support near 21-day MA after trading in the red for past couple of days. ETH/USD must break above previous high of 12.54 levels for further upside”, FxWirePro said in a statement.
Immediate resistance is seen at 11.59 (90 EMA) and a break above would see the pair testing 12.40 (100-day MA)/13.47 (78.6% retracement of 15.23 and 7.00).
On the flipside, support is likely to be found at 11.21 (200-day MA) and a close below would drag the pair to 10.00 (psychological level) and then to 9.77(50% retracement of 7 and 12.54).

- News

- Economy

- Central Banks
- Investing
- Research
- Roundups
- Digital Currency
- Insights
- Technical Analysis
- Technology
- Business
- Law
- Health
- Nature
- Fintech
- Science
- Topic
- Opinions
- ©Econometrics LLC . All Rights Reserved.
ETH/USD takes support at 21-day MA, bullishness only above 12.54
Friday, September 9, 2016 10:31 AM UTC
Editor's Picks


- Market Data
Most Popular


