


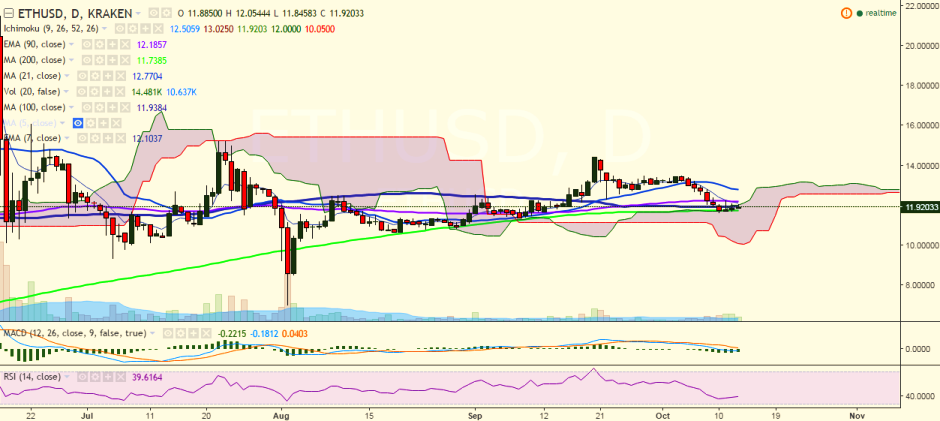
ETH/USD is struggling to close above 100-day MA. It is currently trading 11.92 levels at the time of writing (Kraken).
Long-term trend: Neutral
Short-term trend: Bullish
Ichimoku analysis of daily chart:
Tenkan Sen: 12.55
Kijun Sen: 13.02
Trend reversal: 12.19 (90 EMA)
“The pair is trying to get its upward momentum after hitting a low of 11.60 levels. On the upside, the pair is struggling to break above 7-EMA and a close above would see the pair testing 12.68 levels (38.2% retracement of 14.45 and 11.60)”, FxWirePro said in a statement.
ETH/USD faces major resistance at 12.19 (90 EMA) and any violation would send the pair 12.83 (21-Day MA)/13.50 (October 04 high).
On the downside, support is seen at 11.73 (200-DMA) and a break below would target 11.60 levels (October 10 low)/11.35 (September 08 low).

- News

- Economy

- Central Banks
- Investing
- Research
- Roundups
- Digital Currency
- Insights
- Technical Analysis
- Technology
- Business
- Law
- Health
- Nature
- Fintech
- Science
- Topic
- Opinions
- ©Econometrics LLC . All Rights Reserved.
ETH/USD struggles to break above 7-day EMA, close above targets 12.68
Thursday, October 13, 2016 9:31 AM UTC
Editor's Picks


- Market Data
Most Popular


3


