


AUD/NZD chart - Trading View
AUD/NZD was trading 0.43% lower on the day at 1.0723 at around 09:45 GMT, outlook turns bearish.
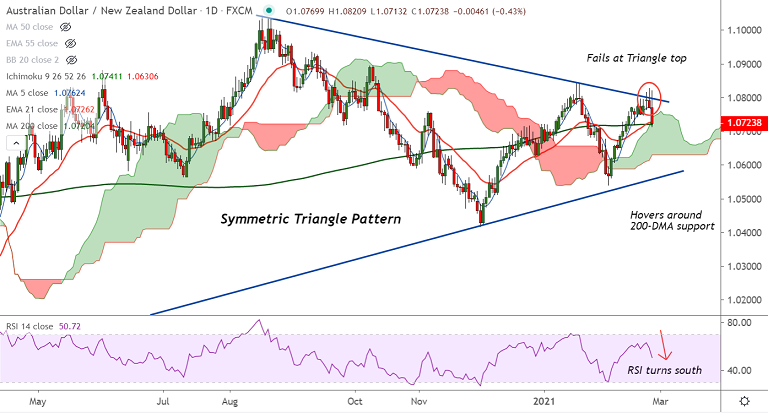
The pair was rejected at Triangle top resistance and is retreating from multi-week highs at 1.0827.
Price action has slipped below 200H MA and the pair now hovers around pivotal support at 200-DMA at 1.0720.
The kiwi has continued to strengthen following the RBNZ’s upbeat economic outlook. The RBNZ acknowledged stronger growth but said that loose policy is to stay.
Technical indicators are turning bearish. Price action has retraced into daily cloud. RSI has turned south. Break below 200-DMA will plummet prices further.
Supports align at 1.07 (55-EMA), 1.0683 (200W MA), 1.0652 (110W EMA). While resistances are seen at 1.0769 (200H MA), 1.08 (Trendline), 1.0843 (Jan 19th high).
Major trend is neutral. Decisive break above 55 month EMA at 1.0736 could change near-term dynamics.


