


 Moody's Upgrades Argentina's Credit Rating Amid Economic Reforms
  FxWirePro- Major Crypto levels and bias summary
  JPMorgan Lifts Gold Price Forecast to $6,300 by End-2026 on Strong Central Bank and Investor Demand
  Urban studies: Doing research when every city is different
  Gold Prices Slide as Rate Cut Prospects Diminish; Copper Gains on China Stimulus Hopes
  UBS Predicts Potential Fed Rate Cut Amid Strong US Economic Data
  Lithium Market Poised for Recovery Amid Supply Cuts and Rising Demand
  Wall Street Analysts Weigh in on Latest NFP Data
  U.S. Treasury Yields Expected to Decline Amid Cooling Economic Pressures
  Nasdaq Proposes Fast-Track Rule to Accelerate Index Inclusion for Major New Listings
  Goldman Predicts 50% Odds of 10% U.S. Tariff on Copper by Q1 Close
  Fed May Resume Rate Hikes: BofA Analysts Outline Key Scenarios
  Moldova Criticizes Russia Amid Transdniestria Energy Crisis


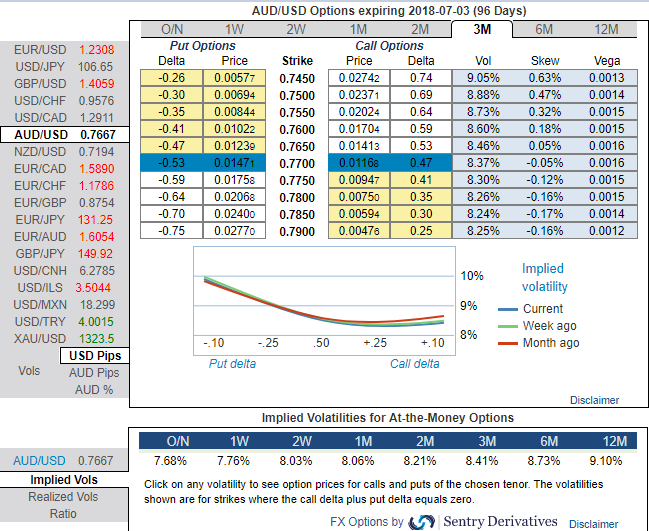
AUDUSD near-term momentum appears to be negative, targeting the 0.7650 areas if the USD rebound persists.
Optimism over global growth remains intact though US-driven trade tensions pose downside risks to global trade volumes and AUD. We look for 0.76 end-Mar and 0.74 end-Q2’2018.
OTC outlook and hedging perspectives:
While using rising IVs of longer tenors coupled with the positive shifts adding to risk reversal numbers, while positively skewed IVs on OTM put strikes could be interpreted as an opportunity to deploy longs in OTM puts with theta shorts in ITM put on time decay advantage as the spot FX market reckons the price has downside potential for large movement in the days to come which is resulting option holders’ on competitive advantage. The positive shift in bearish RRs with positively skewed IVs on OTM puts appears to be slightly puzzling, Isn’t this? It is bouncy for hedgers who have AUD payable exposures.
Without disregarding the Fed’s further rate hiking cycle in 2018, the bearish stance of the pair has been substantiated by technical indications (as stated in our recent post, refer our technical section) and positively skewed IVs of 3m tenors which is an opportunity for put longs in long-term as the US central bank likely to continue hiking phase.
Accordingly, we had advocated put ratio back spreads a couple of days ago, wherein short leg is functioning as the underlying spot FX keeps spiking.
Both the speculators and hedgers for bearish risks are advised to capitalize on the prevailing price rallies by bidding 3m theta shorts, 3m risks reversals to optimally utilize Vega longs.
On hedging grounds, fresh Vega longs for long-term hedging, more number of longs comprising of OTM instruments and ITM shorts in short-term would optimize the strategy.
So, the execution of hedging positions goes this way:
Short 3m (1%) ITM put option, simultaneously, go long in 2 lots of vega long in 3m (1%) OTM -0.39 delta put options. A move towards the ATM territory increases the Vega, Gamma, and Delta which boosts premium.
Thereby, the above positions address both upswings that are prevailing in short run and bearish risks in long run by vega longs.
Precisely from the above payoff graph, we can comprehend –
1. If underlying spot FX slides down, then the profits are unlimited (refer positive shift in payoff structure).
2. Well, there is only one breakeven point at 0.7401 levels.
3. The spot FX point at which highest loss occurs is at 0.7590 levels.
4. If spot FX markets spike up, then the yields would be limited.
Currency Strength Index: FxWirePro's hourly AUD spot index is inching towards -34 levels (which is bearish), while hourly USD spot index was at a tad below 82 (bullish) while articulating (at 10:41 GMT). For more details on the index, please refer below weblink:
http://www.fxwirepro.com/currencyindex.
FxWirePro launches Absolute Return Managed Program. For more details, visit:


