


 Lithium Market Poised for Recovery Amid Supply Cuts and Rising Demand
  European Stocks Rally on Chinese Growth and Mining Merger Speculation
  China’s Growth Faces Structural Challenges Amid Doubts Over Data
  US Gas Market Poised for Supercycle: Bernstein Analysts
  Geopolitical Shocks That Could Reshape Financial Markets in 2025
  Stock Futures Dip as Investors Await Key Payrolls Data
  Mexico's Undervalued Equity Market Offers Long-Term Investment Potential


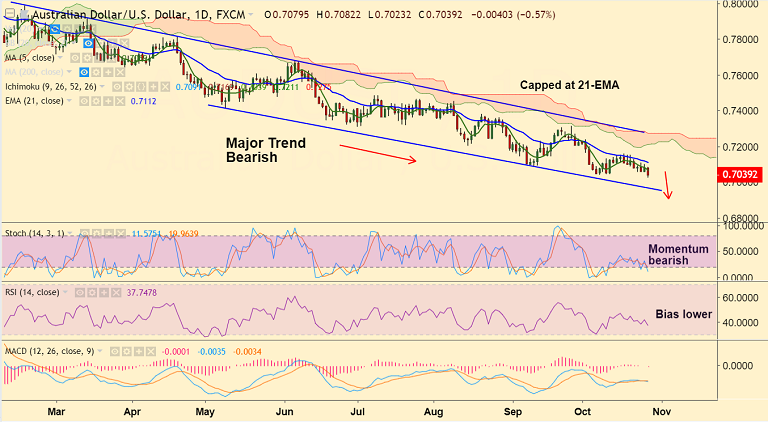
AUD/USD chart on Trading View used for analysis
- AUD/USD trades 0.69% lower on the day at 0.7032 at the time of trading.
- The pair has hit new multi-month lows, levels unseen since Feb 2016.
- Major trend remains bearish. Price action grinds lower in sloping channel pattern.
- Technical studies support further weakness. We see no signs of reversal in the pair.
- Next major support lies at 0.6975 (channel base), breach there will accentuate weakness.
- On the flip side, 21-EMA at 0.7112 is strong resistance. Break above to see further gains.
Support levels - 0.70, 0.6975 (channel base)
Resistance levels - 0.7067 (5-DMA), 0.7112 (21-EMA)
Recommendation: Good to stay short on upticks, SL: 0.7112, TP: 0.70/ 0.6975
For details on FxWirePro's Currency Strength Index, visit http://www.fxwirepro.com/currencyindex.


