


 FxWirePro: EUR/ NZD steadies around 2.0150, retains bid tone
  FxWirePro: EUR/ NZD loses momentum but outlook is bullish
  FxWirePro: NZD/USD cautiously bid as traders sense end to Iran war
  FxWirePro: USD/JPY firms as Trump's address on Gulf war spark fresh concerns
  FxWirePro- Major Crypto levels and bias summary
  AUDJPY Pullback Intensifies: Resistance at 110.00 Signals Short Opportunity
  Yen Resurgence Drives GBPJPY to 2.5-Week Low: Sellers Aim for 208.00
  Bitcoin Recovers Amid Easing Geopolitics: Bulls Target USD 80,000 Support Rebound
  FxWirePro:NZD/USD drifts lower, could be on verge of bigger drop
  FxWirePro: USD/ZAR fibo rejection triggers sizeable pullback
  FxWirePro: GBP/USD recovers but bears are not done yet again
  FxWirePro: USD/CNY dips as China’s yuan strengthens on Iran war de escalation hopes
  Euro Bulls Charge Past 1.1600: Broad Dollar Sell-Off Ignites Powerful EURUSD Rally
  FxWirePro: USD/JPY neutral in the near-term, scope for downward resumption
  EUR/JPY Bulls Charge: Eyeing 186.00 as Euro Strength Intensifies
  FxWirePro: USD/CAD runs out of steam but maintains bullish outlook


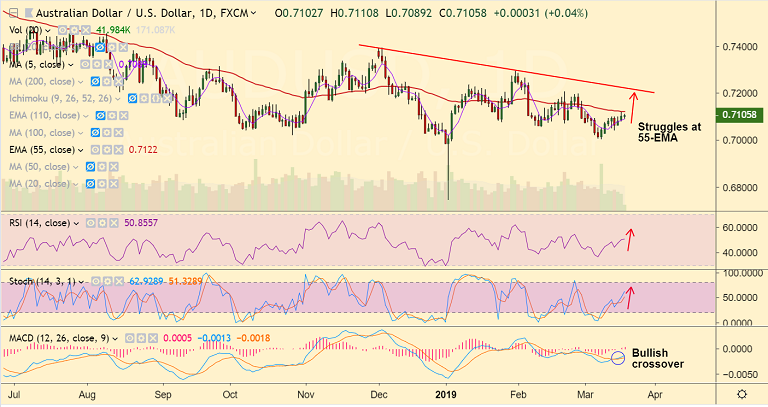
AUD/USD chart - Trading View
- AUD/USD is trading in a narrow range, capped below 55-EMA resistance.
- RBA minutes and housing data disappointed the Aussie bulls. However downside limited amid improved risk sentiment.
- RBA minutes conveyed significant uncertainties on the economic outlook and noted that the next move could be in either direction depending upon the incoming data.
- Further, Q4 house price index details dropped to -2.4% Q/Q, more than -2.0% forecast and -1.5% earlier.
- The yearly data marked -5.1% contraction versus -0.4% market consensus and -1.9% prior.
- That said, expectations of a dovish FOMC result on Wednesday continue to favor the pair’s upside momentum.
- Focus also on U.S. Jan Factory Orders for an immediate catalyst. The factory orders are expected to grow by +0.3% against +0.1% previous expansion.
- Technical studies support upside in the pair. Break above 55-EMA will see test of 110-EMA.
- Major trend is bearish. Rejection at 55-EMA and close below 5-DMA will see downside continuation.
Support levels - 0.7094 (21-EMA), 0.7089 (5-DMA), 0.7003 (Mar 8 low)
Resistance levels - 0.7122 (55-EMA), 0.7164 (110-EMA), 0.7225 (200-DMA)
For details on FxWirePro's Currency Strength Index, visit http://www.fxwirepro.com/currencyindex.


