


 FxWirePro- Major Crypto levels and bias summary
  Global Markets React to Strong U.S. Jobs Data and Rising Yields
  FxWirePro: USD/CNY falls to three-year high, scope for further downside
  FxWirePro: AUD/USD spikes as Trump announces two-week Iran ceasefire
  S&P 500 Relies on Tech for Growth in Q4 2024, Says Barclays
  China’s Growth Faces Structural Challenges Amid Doubts Over Data
  FxWirePro- Major Pair levels and bias summary
  Trump’s "Shock and Awe" Agenda: Executive Orders from Day One
  Moldova Criticizes Russia Amid Transdniestria Energy Crisis
  Goldman Predicts 50% Odds of 10% U.S. Tariff on Copper by Q1 Close
  FxWirePro- Major European Indices
  FxWirePro- Woodies Pivot(Major)
  U.S. Treasury Yields Expected to Decline Amid Cooling Economic Pressures
  FxWirePro: USD/ZAR continues to recovers , upside pressure builds
  FxWirePro: GBP/AUD downtrend extends, eyes 1.8900 evel
  US Futures Rise as Investors Eye Earnings, Inflation Data, and Wildfire Impacts
  Bitcoin's Tug-of-War: Bulls Eye 80,000 USD Despite Turbulent ETF Outflows


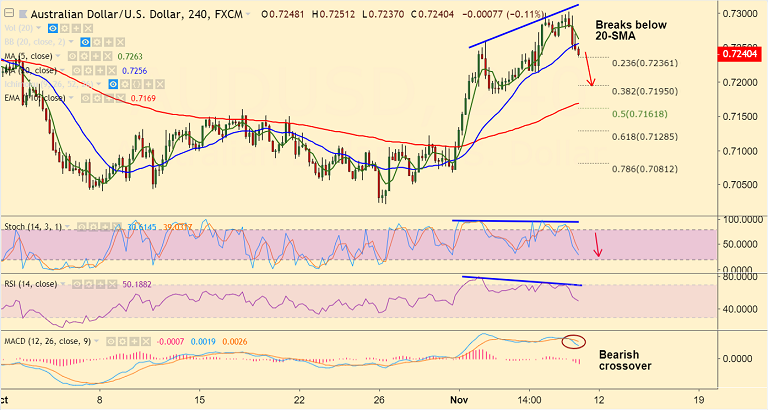
AUD/USD chart on Trading View used for analysis
- Aussie extends weakness on dismal China inflation data and bearish technical setup on intraday charts raises scope for further weakness.
- China's October factory-gate inflation gauge came-in at 3.3 percent, missing estimates at 3.4 percent and down from the previous month's reading of 3.6 percent.
- Also, the Aussie was largely unimpressed by the Reserve Bank of Australia's (RBA) latest Statement of Monetary Policy.
- The RBA maintained their no-movement stance on interest rates or monetary policies in general.
- We see the major has formed a bearish divergence on RSI and Stochs on the 4-hourly charts.
- The pair has slipped below 20-SMA on the 4H chart and has tested 23.6% Fib at 0.7236.
- Stochs and RSI are sharply lower and we see bearish MACD line crossover on signal line which raise scope for further weakness.
Support levels - 0.7195 (38.2% Fib), 0.7169 (4H 110-EMA), 0.7143 (20-DMA)
Resistance levels - 0.7283 (110-EMA), 0.73
Recommendation: Good to go short on upticks around 0.7245/55, SL: 0.7285, TP: 0.72/ 0.7170
For details on FxWirePro's Currency Strength Index, visit http://www.fxwirepro.com/currencyindex.


