


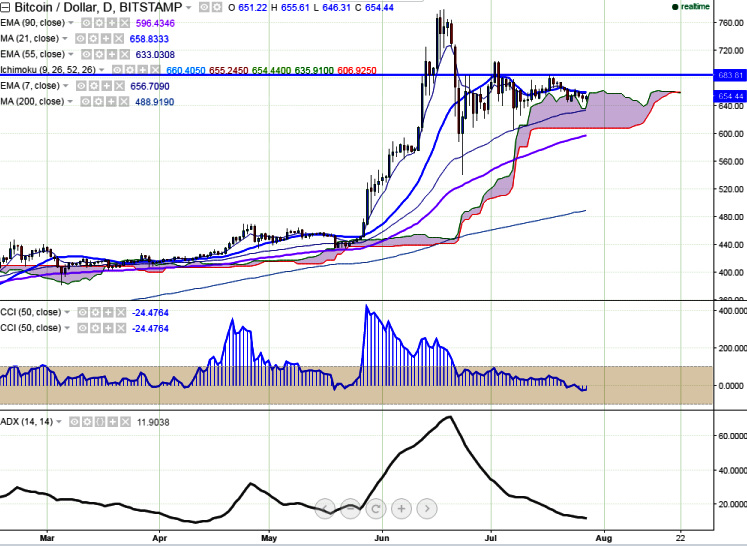
BTC/USD is seen trading above on Wednesday. The pair has slightly recovered after making a low of $645 (BITSTAMP). It is currently trading at $654.92 at the time of writing.
Ichimoku analysis of daily chart shows:
Tenkan-Sen level: $663
Kijun-Sen level: $655.24
Trend reversal level - (90 EMA)-$595.13
Long-term trend remains to be bullish. BTC/USD faces strong resistance at $665. So a slight bullishness can be seen only above that level.
Major resistance is around $665 (Jul 24th high) and any break above targets $685 (Jun25th high)/ $705 (Jul 2nd high). Short term support is seen at $645 (Jul 22nd low) and any violation below will drag the pair till $630 (55 days EMA)/$605 (Jul 7th low).

- News

- Economy

- Central Banks
- Investing
- Research
- Roundups
- Digital Currency
- Insights
- Technical Analysis
- Technology
- Business
- Law
- Health
- Nature
- Fintech
- Science
- Topic
- Opinions
- ©Econometrics LLC . All Rights Reserved.
FxWirePro: BTC/USD faces strong resistance at $665, good to sell the rallies
Wednesday, July 27, 2016 7:04 AM UTC
Editor's Picks


- Market Data
Most Popular


