


 FxWirePro: EUR/AUD eases slightly but trend is still bullish
  FxWirePro: EUR/ NZD steadies around 2.0150, retains bid tone
  FxWirePro: GBP/NZD remains buoyant, looks to extend gains
  FxWirePro: USD/ZAR fibo rejection triggers sizeable pullback
  Ethereum Retreats Toward USD 2,000: Technicals Signal Caution as ETH Mimics Bitcoin’s Pullback
  FxWirePro: USD/CNY gains some ground but bearish outlook persists
  FxWirePro- Major Crypto levels and bias summary
  FxWirePro- Major Pair levels and bias summary
  FxWirePro- Woodies Pivot(Major)
  EUR/JPY Bulls Charge: Eyeing 186.00 as Euro Strength Intensifies
  FxWirePro: USD/CAD runs out of steam but maintains bullish outlook
  FxWirePro: GBP/USD outlook weaker on renewed downside pressure
  FxWirePro: AUD/USD downside pressure builds, key support level in focus
  FxWirePro: EUR/ NZD consolidating around 2.0180 room for further gains
  FxWirePro: USD/JPY firms as Trump's address on Gulf war spark fresh concerns


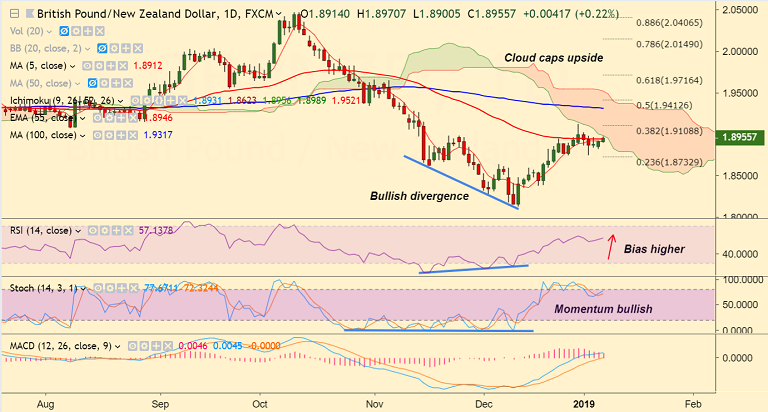
GBP/NZD chart on Trading View used for analysis
- GBP/NZD is trading 0.18% higher on the day at 1.8943 at 0930 GMT.
- The pair finds stiff resistance at daily cloud and break above cloud base to see further gains.
- Technical studies support upside in the pair. Stochs and RSI show bullish momentum.
- The pair is recovering from over 1-year lows at 1.8125 and is extending sideways below 55-EMA resistance.
- We notice a bullish divergence on RSI and Stochs which supports upside in the pair.
- Break above cloud base finds next major resistance at 38.2% Fib at 1.91 ahead of 100-DMA at 1.9317.
- Immediate support is seen at 5-DMA at 1.8908. Break below sees dip till 1.8732.
Support levels - 1.8908 (5-DMA), 1.8732 (23.6% Fib), 1.8625 (Nov 16 low)
Resistance levels - 1.8989 (cloud base), 1.91 (38.2% Fib), 1.9317 (100-DMA)
For details on FxWirePro's Currency Strength Index, visit http://www.fxwirepro.com/currencyindex.


