


 FxWirePro- Major Crypto levels and bias summary


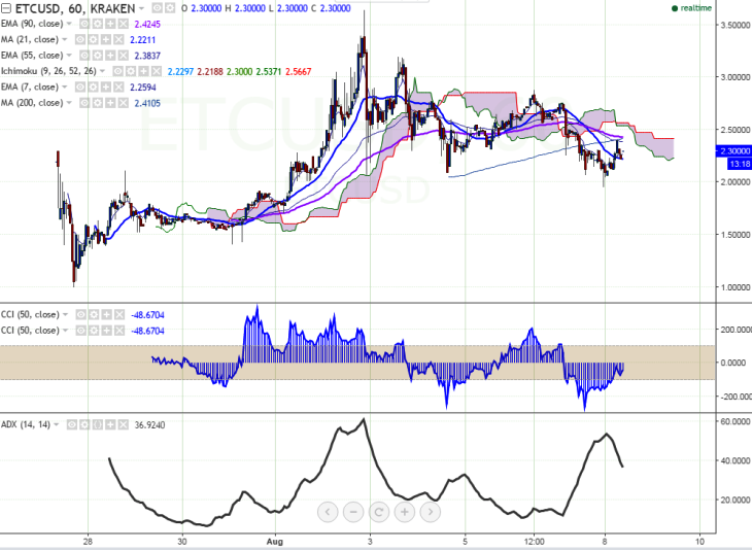
ETC/USD jumped till 200 HMA and declined from that level. It is currently trading around $2.30 (Kraken).
Short term trend: bearish
Ichimoku analysis (Hourly chart):
Tenkan-Sen level: $2.17
Kijun-Sen level: $2.23
Trend reversal level - (90 EMA) - $2.439
“The pair recovered till $2.399 at the time of writing from the low of $1.95. ETC/USD should break above 90 H EMA for further bullishness”, FxWirePro said in a statement.
Any violation above $2.44 will take the pair to next level till $2.55 (61.8% retracement of $2.87 and $1.95)/$2.73/$2.880 (Aug 6 high). On the lower side, minor support is around $2.220 (hourly Kijun-Sen) and break below targets $1.95/$1.65 (161.8% retracement of $1.95 and $2.399).

- News

- Economy

- Central Banks
- Investing
- Research
- Roundups
- Digital Currency
- Insights
- Technical Analysis
- Technology
- Business
- Law
- Health
- Nature
- Fintech
- Science
- Topic
- Opinions
- ©Econometrics LLC . All Rights Reserved.
FxWirePro: ETC/USD struggles to close above 200 HMA, good to sell on rallies
Monday, August 8, 2016 9:54 AM UTC
Editor's Picks


- Market Data
Most Popular


