


 FxWirePro- Major Crypto levels and bias summary
  BTC Flat at $89,300 Despite $1.02B ETF Exodus — Buy the Dip Toward $107K?


Technical glance:
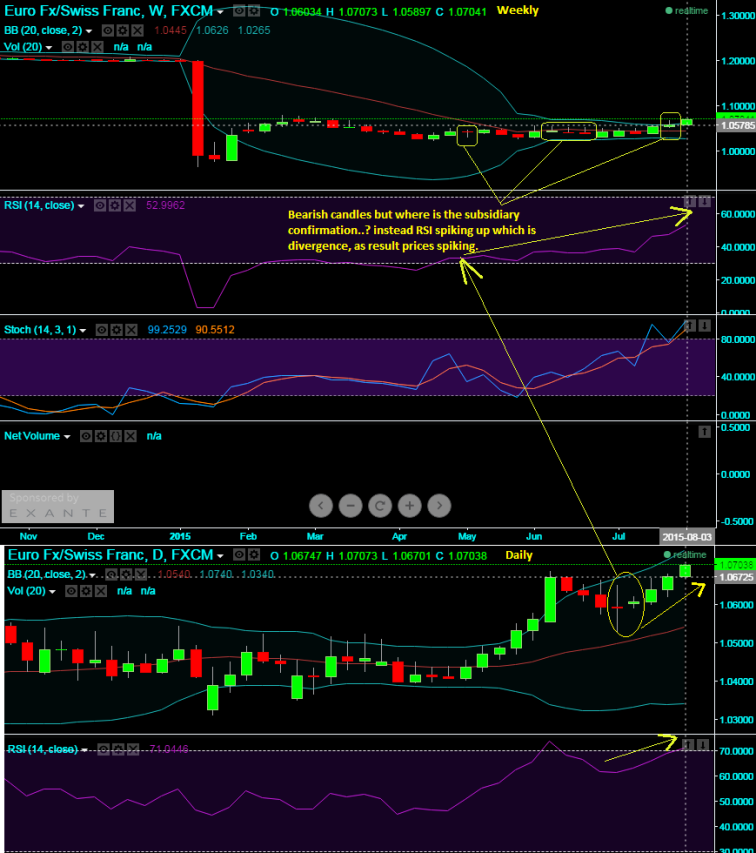
Flurry of bearish sentiments but bears could not hold the momentum: The behavioral approach of bearish candles has been entirely different on both daily as well as weekly charting patterns. We state this because despite the fact that there was a long spell of bearish candles such as occurrence dojis back to back, you can observe how leading momentum oscillators are supporting rising prices gradually. Infact, a long legged doji on EOD charts which was supposed to show dips have behaved adversely.
Usually long-legged doji suggests that the forces of supply and demand are nearing equilibrium and that a shift in the direction of the trend may be coming. But the doji at this juncture at 1.0593 showed that there was indecision between the buyers and the sellers but prices acted adversely and that the market was approaching transition period.
Never blame technicals: Many immature traders would have burnt their hands by now by blaming technicals looking at the above stated bearish candles. The market does not need to behave as how your instincts wish to, instead the outcomes as a result of lots of heterogeneous factors. After having a glance on previous trend, 2 questions would pop up as follows and relative solutions are also quoted in brackets:
Was there a downtrend at all..? (Trend is your friend, never dare to buck the trend).
Was there any substantial confirmation by other subsidiary indicators..? (Technicals should not be studied in isolation).
Momentum oscillators: 14 weeks RSI is pretty much positive for bulls as it is positively converging with rising prices, while slow stochastic curve reached overbought zone though, clear indication has not been traced out but more buying interest seen.
Trade Recommendation:
We reckon it is good pair to buy at dips as the reasoning being quite simple, leading oscillators on intraday and daily charts have just approached 70 levels which is overbought territory and it may likely offer good entry points by forming some minor dips.
So trade objective is gain from prevailing trend but at the ideal entry points at every dips, immediate support seen at 1.0704 and at 1.0701 levels.

- News

- Economy

- Central Banks
- Investing
- Research
- Roundups
- Digital Currency
- Insights
- Technical Analysis
- Technology
- Business
- Law
- Health
- Nature
- Fintech
- Science
- Topic
- Opinions
- ©Econometrics LLC . All Rights Reserved.
FxWirePro: EUR/CHF bears fail to hold momentum despite flurry of doji patterns; momentum indicator signals good buy at dips
Thursday, August 6, 2015 8:43 AM UTC
Editor's Picks


- Market Data
Most Popular


