


 FxWirePro- Major Pair levels and bias summary
  FxWirePro: GBP/USD bulls remain cautiously optimistic
  FxWirePro- Major Pair levels and bias summary
  FxWirePro: USD/CAD recovers slightly but bearish outlook persists
  FxWirePro- Major Crypto levels and bias summary
  FxWirePro: EUR/AUD under pressure as key support gives way
  Euro Holds the Line: EURUSD Finds Support at the 365-EMA as Peace Talks Loom
  FxWirePro: GBP/NZD up trend gains some momentum but hurdles ahead
  FxWirePro: USD/ZAR edges lower ,investors remain on edge
  FxWirePro: USD/CAD extends decline on broad dollar weakness
  FxWirePro:NZD/USD uptrend loses momentum but bullish setup remains
  FxWirePro: USD/JPY holding bid into weekend
  FxWirePro- Woodies Pivot(Major)
  FxWirePro: GBP/AUD gains some upside momentum but still bearish
  FxWirePro: EUR/AUD downtrend loses steam but outlook still bearish
  FxWirePro- Major European Indices


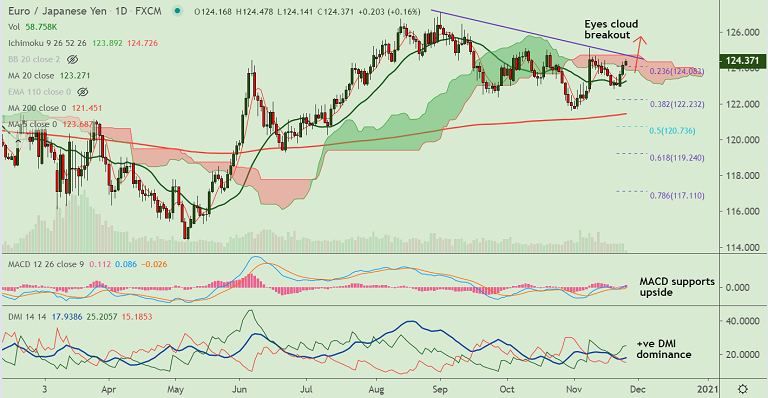
EUR/JPY chart - Trading View
Technical Analysis: Bias Turning Bullish
GMMA Indicator
- Long term moving averages are constricted and flat suggesting major trend is neutral
- Near term moving averages are biased higher and spread id widening suggesting minor trend is bullish
Ichimoku Analysis
- Price action has pierced into the daily cloud and the pair trades above weekly cloud
- Chikou span on the daily charts is biased higher, suggests more gains likely
Oscillators
- Stochs and RSI are biased higher on the daily charts, momentum bullish
- Stochs show bullish roll over from oversold levels on the weekly charts
Bollinger Bands
- Bollinger bands are widening on the daily charts and narrowing on the weekly charts
- Rising volatility on the daily charts could drive near-term upside. Any break above major resistance could change the weekly dynamics
Major Support Levels: 124.08 (23.6% Fib), 123.68 (5-DMA), 123.27 (20-DMA)
Major Resistance Levels: 124.72 (cloud top), 125.19 (200W MA), 125.95 (50% Fib)
Summary: Euro appreciates across the board. Positive market sentiment amid promising COVID-19 vaccine news and upbeat data translates into solid advances for the pair. Eurozone macroeconomic figures have also beaten expectations. The German IFO business climate survey and third quarter’s GDP have shown better than expected readings. Bullish technical setup aids further upside in the pair. Cloud offers immediate hurdle at 124.72. Scope for test of 200W MA at 125.19 on break above.


