


 Wall Street Analysts Weigh in on Latest NFP Data
  U.S. Banks Report Strong Q4 Profits Amid Investment Banking Surge
  US Futures Rise as Investors Eye Earnings, Inflation Data, and Wildfire Impacts
  UBS Predicts Potential Fed Rate Cut Amid Strong US Economic Data
  S&P 500 Relies on Tech for Growth in Q4 2024, Says Barclays
  U.S. Stocks vs. Bonds: Are Diverging Valuations Signaling a Shift?
  Urban studies: Doing research when every city is different
  Stock Futures Dip as Investors Await Key Payrolls Data
  Moody's Upgrades Argentina's Credit Rating Amid Economic Reforms
  Gold Prices Slide as Rate Cut Prospects Diminish; Copper Gains on China Stimulus Hopes
  2025 Market Outlook: Key January Events to Watch


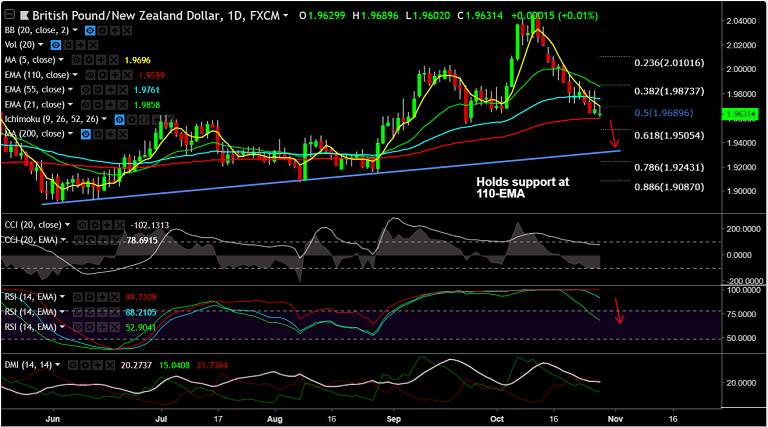
GBP/NZD chart on Trading View used for analysis
- GBP/NZD is trading largely muted at the time of writing, at 1.9631 at the time of writing.
- The pair is in a downtrend since 10th Oct after hitting multi-month highs of 2.047.
- Price action is currently holding support at 110-EMA at 1.96, break below will see resumption of weakness.
- Technical studies on daily charts are turning bearish. The pair has been on the decline for the 4th straight week.
- Next major support lies at 61.8% Fib at 1.9505 ahead of 1.93 (major trendline support).
- Rejection and bounce off 110-EMA eyes immediate resistance at 1.9761 (55-EMA) ahead of 1.9858 (21-EMA).
Support levels - 1.96 (110-EMA), 1.95 (61.8% Fib), 1.93 (trendline)
Resistance levels - 1.9695 (5-DMA), 1.9761 (55-EMA), 1.9857 (21-EMA)
Recommendation: Good to stay short on break below 110-EMA, SL: 1.9695, TP: 1.95/ 1.93
For details on FxWirePro's Currency Strength Index, visit http://www.fxwirepro.com/currencyindex.


