


 Nasdaq Proposes Fast-Track Rule to Accelerate Index Inclusion for Major New Listings
  FxWirePro- Major Crypto levels and bias summary


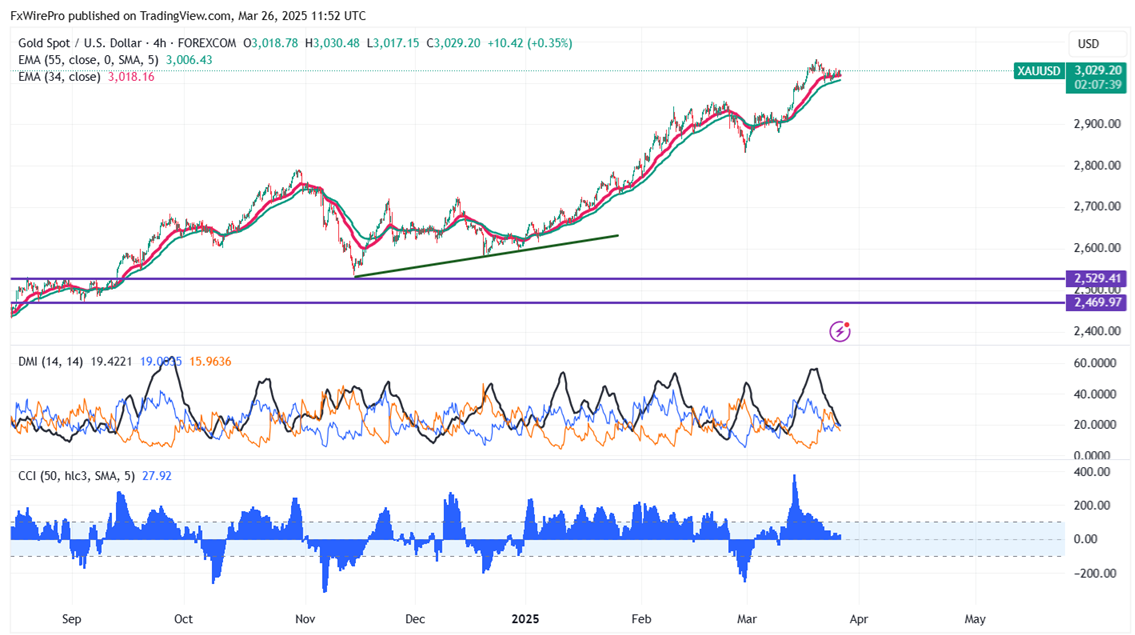
Gold trades flat with no proper direction after hitting an all-time high at $3057. It hit a low of $2999 and is currently trading around $3028.
In February 2025, U.S. sales of new single-family homes rose by 1.8% to a seasonally adjusted annual rate of 676,000 units, an improvement over January's 664,000. This is an increase of 5.1% compared to February 2024. The median new-home price fell by 1.5% to $414,500.
In March 2025, the Conference Board Consumer Confidence Index tumbled to 92.9, a post-February 2021 low, as the Expectations Index dropped to 65.2. Also, the Richmond Fed composite manufacturing index dropped to -4, pointing to manufacturing downturn, with softness in shipments, new orders, and jobs. These figures suggest a mixed economic outlook as gains in sales of houses were countered by declining consumer confidence and manufacturing activity.
Rate Pause Expectations Rise
According to the CME Fed Watch tool, the chances of a rate pause in the May 19th, 2025 meeting have increased to 88.40% from 81.30% a week ago.
Technical Analysis: Key Levels and Trading Strategy
Gold prices are holding above the short-term moving averages 34 EMA and 55 EMA and above the long-term moving averages (200 EMA) in the 4-hour chart. Immediate support is at $2995 and a break below this level will drag the yellow metal to $2985/$2956/$2920/$2900/$2880. The near-term resistance is at $3080 (trend line joining $2450 and $2790) with potential price targets at $3100.
It is good to sell on rallies around $3048-50 with a stop-loss at $3080 for a target price of $2835.


