


 Ethereum Rises on Geopolitical De-escalation: Pezeshkian’s Peace Signal Ignites Bullish Momentum
  Yen Resurgence Drives GBPJPY to 2.5-Week Low: Sellers Aim for 208.00
  AUDJPY Pullback Intensifies: Resistance at 110.00 Signals Short Opportunity
  FxWirePro: USD/CAD runs out of steam but maintains bullish outlook
  FxWirePro: USD/JPY neutral in the near-term, scope for downward resumption
  FxWirePro: AUD/USD gains some ground but remains sensitive to Middle East tensions
  FxWirePro: EUR/ NZD steadies around 2.0150, retains bid tone
  FxWirePro- Major Pair levels and bias summary
  FxWirePro: GBP/USD recovers but bears are not done yet again
  FxWirePro: NZD/USD cautiously bid as traders sense end to Iran war
  FxWirePro: USD/CNY dips as China’s yuan strengthens on Iran war de escalation hopes
  FxWirePro: AUD/USD downside pressure builds, key support level in focus
  FxWirePro: GBP/NZD range to extend until there is game changing news
  NZDJPY Technical Outlook: Bearish Bias Deepens as Key Resistances Hold
  FxWirePro: USD/ZAR fibo rejection triggers sizeable pullback
  Euro Bulls Charge Past 1.1600: Broad Dollar Sell-Off Ignites Powerful EURUSD Rally


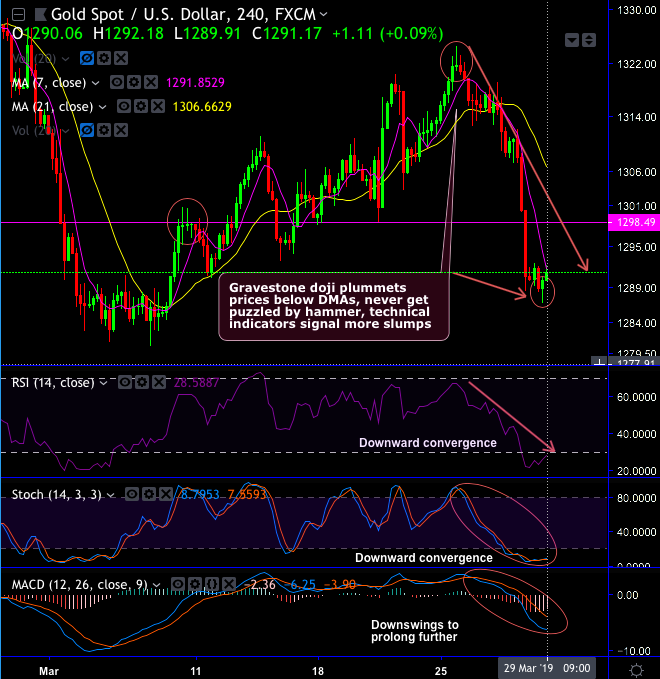
Technical glance: Gold’s (XAUUSD price) has plummeted below 7 & 21-DMAs after gravestone doji at peaks of $1,321.67 levels.
However, it has continued to sense buying sentiments after today’s hammer formation at $1,290.06 levels (on the 4H chart). There is no support from technical indicators as you could observe both RSI & stochastic curves show downward convergence constantly to the steep price dips to indicate selling momentum.
To substantiate this bearish sentiment, the trend indicators also show bearish DMA & MACD crossovers on this timeframe.
On a broader perspective, double top with consecutive shooting stars nudge price below EMAs on monthly plotting. To counter these slumps, ever since the formation of hammer pattern at $1,200.55 levels in Aug’2018 (exactly at double top neckline) we’ve seen more upswings, On the contrary, shootings star pops-up at $1,313.01 level that puzzles the major trend. Both momentum oscillators (RSI &Stochastic curves) substantiate bullish sentiment, but can it be a triple top?
Overall, bulls in the bullion market managed to ensure the consolidation phase, and it is likely to prolong as long as the current price remains above EMAs.
Trading tips: At spot reference: $1,292.05 levels, on trading grounds, one can trade this commodity via boundary options spreads using upper strikes at 1,293.90 and lower strikes at 1,286.65 levels. The strategy is likely to fetch exponential yields as the underlying commodity price remains between these strikes on the expiration.
Currency Strength Index: FxWirePro's hourly EUR is at -21 (mildly bearish), hourly USD spot index is inching towards 69 levels (bullish), while articulating at 11:22 GMT.
For more details on the index, please refer below weblink: http://www.fxwirepro.com/currencyindex


