


 FxWirePro: GBP/USD biased higher but rally currently stretched
  FxWirePro: GBP/AUD positions for another drop, eyes 1.8900level
  FxWirePro: GBP/AUD gains some upside momentum but still bearish
  NZDJPY Bulls Charge Toward 95.00: Safe-Haven Exodus Drives Kiwi Rally
  FxWirePro- Woodies Pivot(Major)
  FxWirePro: USD/CNY neutral in the near-term, scope for downward resumption
  FxWirePro- Major Crypto levels and bias summary
  FxWirePro: AUD/USD retreats slightly but trend is still bullish
  FxWirePro: EUR/AUD under pressure as key support gives way
  Energy Surge Ignites US Inflation: USDCHF Eyes Support Amid Dollar Sell-Off
  Ethereum Consolidates: Bullish Technicals Point to a Potential $3,000 Breakout
  FxWirePro- Woodies Pivot(Major)
  Bitcoin’s Volatile Reset: ETFs Rebound as Bulls Eye USD 80,000 Milestone
  FxWirePro: USD/ZAR recovers slightly but trend is still bearish
  FxWirePro- Major Pair levels and bias summary


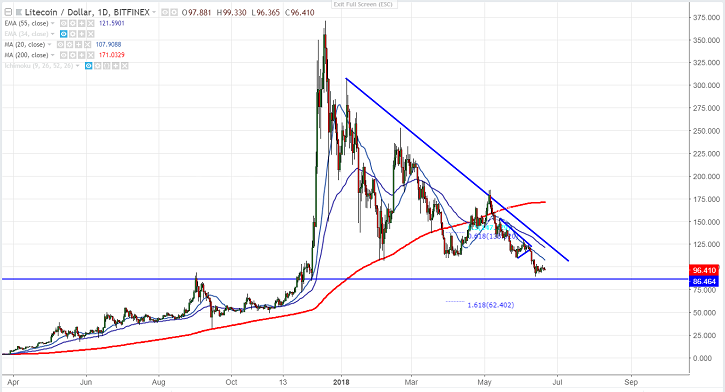
- LTC/USD has shown a minor jump after hitting low of $89.25. The pair declined more than 50% from the temporary top $182.35. It is currently trading around $96.40. It has declined more than $20 in previous week. It has declined almost 79% from the all-time high of $370.
- The near term solid resistance is around $111 (20 day MA) and any break above will take the pair to next level till $115 (34- day /$124 (55- day EMA).
- On the lower side, any break below $84 confirms minor weakness and a decline till $75/$70 is possible.
It is good to sell on rallies around $103-105 with SL around $112 for the TP of $85/$70.


