


 FxWirePro: EUR/AUD under pressure as key support gives way
  FxWirePro: AUD/USD retreats slightly but trend is still bullish
  FxWirePro: GBP/USD biased higher but rally currently stretched
  FxWirePro: GBP/NZD up trend gains some momentum but hurdles ahead
  FxWirePro- Woodies Pivot(Major)
  FxWirePro- Woodies Pivot(Major)
  FxWirePro: USD/ZAR recovers slightly but trend is still bearish
  FxWirePro- Major Pair levels and bias summary
  NZDJPY Bulls Charge Toward 95.00: Safe-Haven Exodus Drives Kiwi Rally
  FxWirePro: USD/JPY holding bid into weekend
  FxWirePro: GBP/AUD positions for another drop, eyes 1.8900level
  FxWirePro- Major Crypto levels and bias summary
  FxWirePro:NZD/USD uptrend loses momentum but bullish setup remains
  Euro Holds the Line: EURUSD Finds Support at the 365-EMA as Peace Talks Loom
  FxWirePro: EUR/CAD gains ground on prospects of resumed energy flows
  Bitcoin’s Volatile Reset: ETFs Rebound as Bulls Eye USD 80,000 Milestone


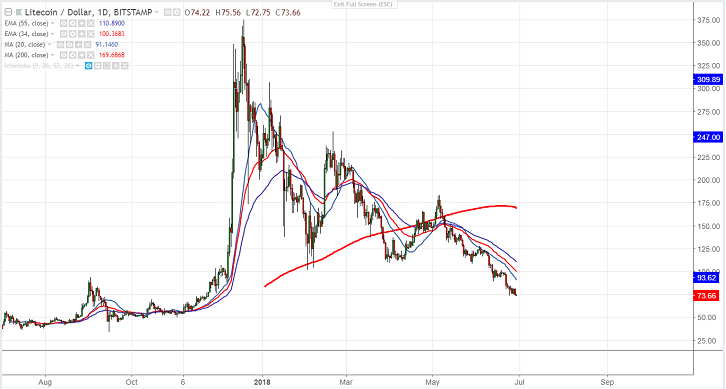
- LTC/USD has shown a minor decline and is trading near 2018 low after showing a minor jump till $84.50. The pair declined more than 50% from the temporary top $182.35. It is currently trading around $73.66.It has declined almost 79% from the all-time high of $370.
- The near term solid resistance is around $93 (20 day MA) and any break above will take the pair to next level till $102 (34- day EMA) /$112.26 (55- day EMA).
- On the lower side, any break below $73 confirms minor weakness and a decline till $70/$60 is possible.
It is good to sell on rallies around $80-82 with SL around $105 for the TP of $75/$70.


