


 FxWirePro- Major Crypto levels and bias summary
  FxWirePro: EUR/ NZD consolidating around 2.0180 room for further gains
  NZDJPY Bears Take Control: New Zealand Dollar Retreats as 92 Resistance Holds Firm
  FxWirePro: USD/ZAR sustains gains as uptrend remains strong
  FxWirePro: GBP/USD outlook weaker on renewed downside pressure
  FxWirePro: USD/ZAR fibo rejection triggers sizeable pullback
  EUR/JPY Bulls Charge: Eyeing 186.00 as Euro Strength Intensifies
  FxWirePro: USD/CAD runs out of steam but maintains bullish outlook
  FxWirePro- Woodies Pivot(Major)
  FxWirePro: GBP/NZD range to extend until there is game changing news
  FxWirePro: USD/CNY gains some ground but bearish outlook persists
  Bitcoin Battles Volatility: Institutional Support Eyes USD 64,000 Floor Amid Geopolitical Tensions
  FxWirePro: GBP/USD recovers but bears are not done yet again
  FxWirePro- Major Crypto levels and bias summary
  Ethereum Retreats Toward USD 2,000: Technicals Signal Caution as ETH Mimics Bitcoin’s Pullback
  Euro Retreats as Geopolitical Tensions Surge: EURUSD Eyes 1.1400 Floor Amid Safe-Haven Demand


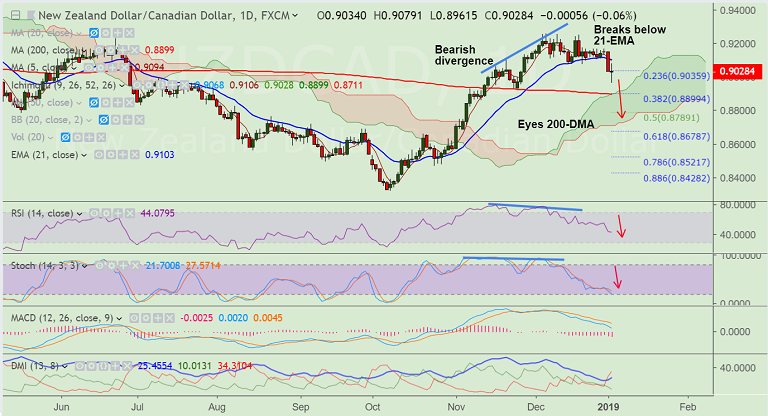
NZD/CAD chart on Trading View used for analysis
- NZD/CAD extends previous session's slump, intraday bias bearish.
- The pair hit 4-week lows at 0.8961 before paring some losses to currently trade at 0.9015.
- Price action has slipped below 21-EMA support raising scope for further weakness.
- Bearish divergence on RSI and Stochs along with -ve DMI dominance adds to the bearish bias.
- Next bear target lies at 200-DMA at 0.89. Violation there will see dip till 61.8% Fib at 0.8678.
- On the flipside, retrace above 21-EMA could see some consolidation.
Support levels - 0.89 (converged 200-DMA and 38.2% Fib), 0.8789 (50% Fib), 0.8678 (61.8% Fib)
Resistance levels - 0.9101 (21-EMA), 0.92, 0.9256 (Dec high)
Recommendation: Good to go short on upticks. SL: 0.91, TP: 0.89/ 0.8790/ 0.8680


