


 FxWirePro: USD/CAD runs out of steam but maintains bullish outlook
  2025 Market Outlook: Key January Events to Watch
  FxWirePro- Major Crypto levels and bias summary
  FxWirePro: USD/CNY gains some ground but bearish outlook persists
  Aussie Retreats Against the Yen: AUDJPY Bears Target 108 as 110 Resistance Holds Firm
  FxWirePro:NZD/USD drifts lower, could be on verge of bigger drop
  FxWirePro: AUD/USD downside pressure builds, key support level in focus
  U.S. Treasury Yields Expected to Decline Amid Cooling Economic Pressures
  Pound Under Pressure as Yen Stabilizes: GBPJPY Bears Target 208 as Key EMAs Hold Resistance
  FxWirePro- Woodies Pivot(Major)
  Gold Prices Fall Amid Rate Jitters; Copper Steady as China Stimulus Eyed
  FxWirePro- Major Pair levels and bias summary
  FxWirePro: EUR/ NZD steadies around 2.0150, retains bid tone
  FxWirePro: GBP/USD recovers but bears are not done yet again
  Indonesia Surprises Markets with Interest Rate Cut Amid Currency Pressure
  Stock Futures Dip as Investors Await Key Payrolls Data
  Goldman Predicts 50% Odds of 10% U.S. Tariff on Copper by Q1 Close


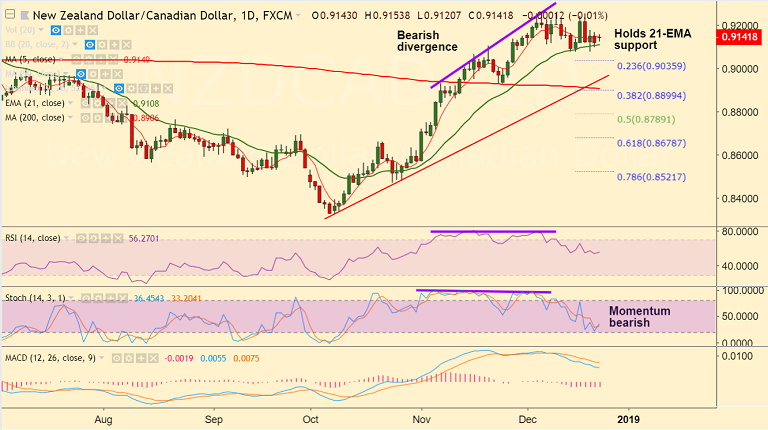
NZD/CAD chart on Trading View used for analysis
- NZD/CAD trades rangebound on the day at 0.9144 at the time of writing.
- The pair is extending sideways grind at strong support at 21-EMA. Break below will see further weakness.
- Technical indicators are biased lower for the day and bearish divergence on RSI and Stochs keeps scope for weakness.
- Break below 21-EMA to see dip till 23.6% Fib at 0.9035. Further weakness will see test of 200-DMA at 0.89.
- Indicators are slowly turning, decisive close above 5-DMA could see resumption of upside. Scope then for test of 0.9250 (Dec 19 high)
Support levels - 0.91 (21-EMA), 0.9035 (23.6% Fib), 0.89 (200-DMA)
Resistance levels - 0.9150 (5-DMA), 0.92, 0.9238 (Upper BB), 0.9250 (Dec 19 high)
For details on FxWirePro's Currency Strength Index, visit http://www.fxwirepro.com/currencyindex.


