


 NZD/JPY Rockets as Kiwi Dollar Resilience Defies the Oil Shock
  FxWirePro: EUR/NZD remains under pressure as key support gives way
  FxWirePro: EUR/AUD falls below 1.6600 level, plunge to test a key fibo grows
  FxWirePro: EUR/AUD claws back some losses but rcovery likely muted
  FxWirePro: AUD/USD spikes as Trump announces two-week Iran ceasefire
  Ethereum Reclaims Higher Ground: Ether Bulls Target $2,700 as Middle East Tensions Thaw
  FxWirePro- Major European Indices
  FxWirePro: GBP/AUD downtrend extends, eyes 1.8900 evel
  FxWirePro: EUR/ NZD downside pressure builds, key support level in focus
  EUR/JPY Breaks Out: Euro Surges Past 185.00 Resistance Amid Strong Bullish Momentum
  FxWirePro- Major Crypto levels and bias summary
  FxWirePro: GBP/USD climbs to 4 -week high as ceasefire deal gives bulls traction
  Pound Sterling Power: GBP/JPY Secures Third Day of Gains as Global Risk Tensions Recede
  FxWirePro: USD/ JPY slips as yen rallies after Mideast ceasefire declaration
  FxWirePro:NZD/USD jumps as RBNZ warns of higher OCR potential


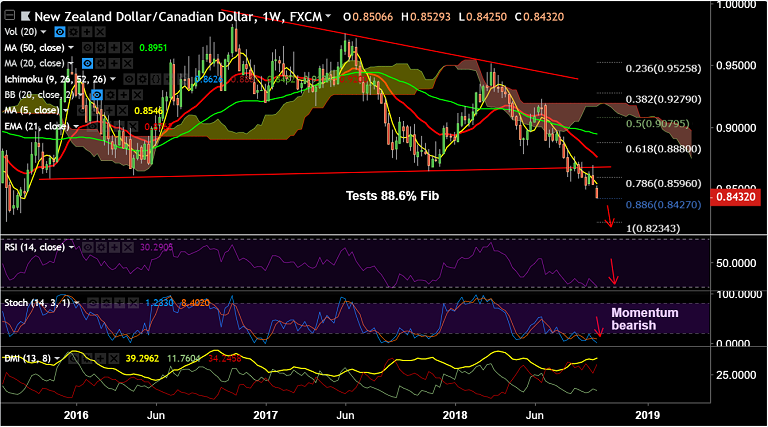
NZD/CAD chart on Trading View used for analysis
- Kiwi tracks sharp losses in its Australian counterpart, extends weakness across the board.
- Investors await Bi-weekly New Zealand GDT auction. Declines in the GDT price index could drag the kiwi lower.
- Focus also on FOMC Chairman Powell speech due later today for further direction. Powell is expected touch on employment and inflation.
- Technical bias is bearish. Price action below major EMAs and upside capped at 55-EMA and cloud.
- RSI and Stochs are sharply lower and MACD shows bearish crossover on signal line. We see -ve DMI crossover on +ve DMI which adds to the bearish crossover.
- Technicals on weekly charts are also strongly bearish. Price is testing 88.6% Fib at 0.8427. Break below to see further weakness.
Support levels - 0.8427 (88.6% Fib), 0.8234 (Aug 2015 low)
Resistance levels - 0.8506 (5-DMA), 0.8570 (21-EMA)
Call update: Our previous call (https://www.econotimes.com/FxWirePro-NZD-CAD-Trade-Idea-1436374) has hit TP1.
Recommendation: Book partial profits at lows. Hold for further weakness below 88.6% Fib.
FxWirePro Currency Strength Index: FxWirePro's Hourly NZD Spot Index was at -32.9275 (Neutral), while Hourly CAD Spot Index was at 27.0931 (Neutral) at 0630 GMT.
For more details on FxWirePro's Currency Strength Index, visit http://www.fxwirepro.com/currencyindex.


