


 Ethereum Retreats Toward USD 2,000: Technicals Signal Caution as ETH Mimics Bitcoin’s Pullback
  NZDJPY Bears Take Control: New Zealand Dollar Retreats as 92 Resistance Holds Firm
  Energy Sector Outlook 2025: AI's Role and Market Dynamics
  FxWirePro: GBP/USD outlook weaker on renewed downside pressure
  FxWirePro- Woodies Pivot(Major)
  FxWirePro: USD/CAD runs out of steam but maintains bullish outlook
  Oil Prices Dip Slightly Amid Focus on Russian Sanctions and U.S. Inflation Data
  Geopolitical Shocks That Could Reshape Financial Markets in 2025
  US Gas Market Poised for Supercycle: Bernstein Analysts
  U.S. Treasury Yields Expected to Decline Amid Cooling Economic Pressures
  Moody's Upgrades Argentina's Credit Rating Amid Economic Reforms
  FxWirePro: EUR/AUD gaining momentum for a move towards 1.6800 level
  Mexico's Undervalued Equity Market Offers Long-Term Investment Potential
  China’s Growth Faces Structural Challenges Amid Doubts Over Data
  FxWirePro: USD/CNY gains some ground but bearish outlook persists
  FxWirePro- Major Pair levels and bias summary


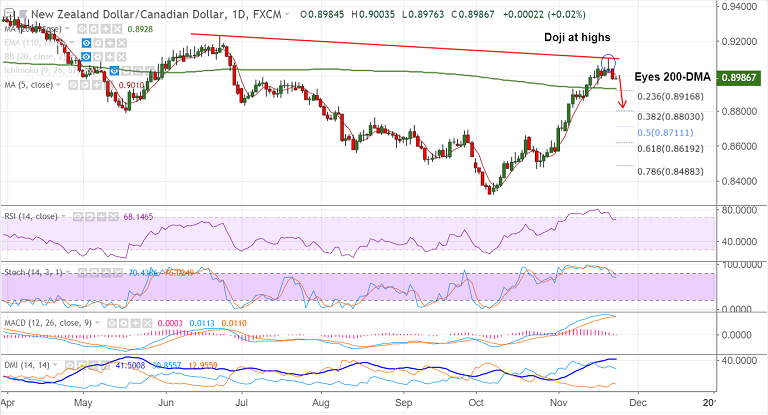
NZD/CAD chart on Trading View used for analysis
- NZD/CAD consolidates previous session's slump, trades largely muted at the time of writing, at 0.8986 levels.
- The pair is extending weakness with 'Gravestone Doji' formation at highs on Wednesday's trade.
- Kiwi sell-off across the board is knocking the pair lower. Technical indocators are turning bearish.
- We also find that the momentum indicators on daily charts are at overbought levels.
- Some unwinding likely. Pair eyes 200-DMA at 0.8928. Breach there could see dip till 20-DMA at 0.8865.
- Major trend remains bullish. Failure to break below 200-DMA will see resumption of upside.
Support levels - 0.8928 (200-DMA), 0.8865 (20-DMA), 0.88 (38.2% Fib)
Resistance levels - 0.9010 (5-DMA), 0.91 (Nov 21 high)
Call update: Our previous call (https://www.econotimes.com/FxWirePro-NZD-CAD-halts-upside-with-Gravestone-Doji-formation-dip-till-08844-likely-1462380) is progressing well.
Recommendation: Hold for targets
For details on FxWirePro's Currency Strength Index, visit http://www.fxwirepro.com/currencyindex.


