


 FxWirePro: EUR/ NZD steadies around 2.0150, retains bid tone
  US Futures Rise as Investors Eye Earnings, Inflation Data, and Wildfire Impacts
  U.S. Treasury Yields Expected to Decline Amid Cooling Economic Pressures
  FxWirePro: GBP/USD recovers but bears are not done yet again
  UBS Projects Mixed Market Outlook for 2025 Amid Trump Policy Uncertainty
  FxWirePro: AUD/USD downside pressure builds, key support level in focus
  Moody's Upgrades Argentina's Credit Rating Amid Economic Reforms
  Goldman Predicts 50% Odds of 10% U.S. Tariff on Copper by Q1 Close
  FxWirePro: EUR/ NZD consolidating around 2.0180 room for further gains
  Indonesia Surprises Markets with Interest Rate Cut Amid Currency Pressure
  Urban studies: Doing research when every city is different
  FxWirePro- Major Crypto levels and bias summary
  Mexico's Undervalued Equity Market Offers Long-Term Investment Potential
  S&P 500 Relies on Tech for Growth in Q4 2024, Says Barclays
  Oil Prices Dip Slightly Amid Focus on Russian Sanctions and U.S. Inflation Data
  FxWirePro: USD/JPY firms as Trump's address on Gulf war spark fresh concerns


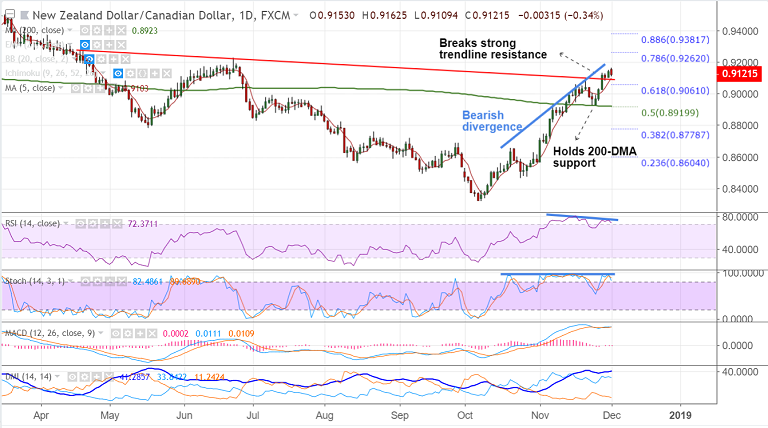
NZD/CAD chart on Trading View used for analysis
- NZD/CAD has slipped lower from fresh 5-month highs at 0.9162.
- The pair is currently trading at 0.9118, down 0.23% on the day.
- Price action has broken above 61.8% Fib and strong trendline resistance at 0.9095.
- Technical indicators are showing some exhaution at overbought levels.
- We also evidence bearish divergence on RSI and Stochs which raises scope for downside.
- However, we do not see any major signs of reversal. 5-DMA is immediate support at 0.9102.
- Retrace below 61.8% Fib could see dip till 200-DMA at 0.8923. Violation at 200-DMA will see bearish continuation.
- On the flipside, price action capped at upper Bollinger Band at 0.9163. Break above weekly cloud at 0.9180 could see test of 78.6% Fib at 0.9262.
For details on FxWirePro's Currency Strength Index, visit http://www.fxwirepro.com/currencyindex.


