


 UBS Projects Mixed Market Outlook for 2025 Amid Trump Policy Uncertainty
  U.S. Banks Report Strong Q4 Profits Amid Investment Banking Surge
  Global Markets React to Strong U.S. Jobs Data and Rising Yields
  U.S. Stocks vs. Bonds: Are Diverging Valuations Signaling a Shift?
  Stock Futures Dip as Investors Await Key Payrolls Data
  China’s Growth Faces Structural Challenges Amid Doubts Over Data
  Bank of America Posts Strong Q4 2024 Results, Shares Rise
  Mexico's Undervalued Equity Market Offers Long-Term Investment Potential
  European Stocks Rally on Chinese Growth and Mining Merger Speculation


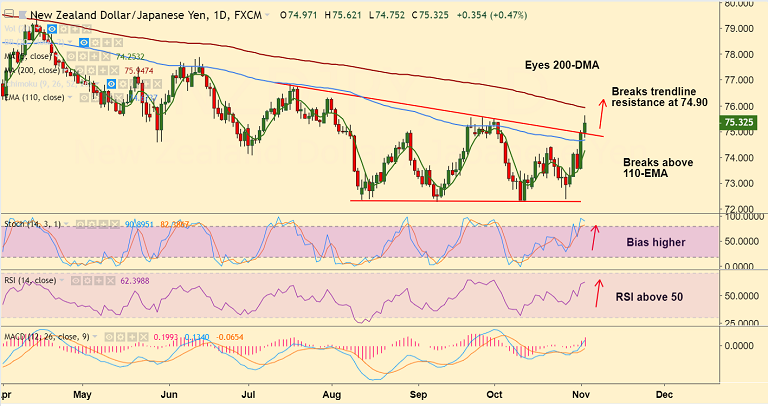
NZD/JPY chart on Trading View used for analysis
- NZD/JPY hits 3-month highs at 75.62 before paring some gains to currently trade at 75.22.
- Technical analysis shows bullish bias. Stochs and RSI are sharply higher and MACD supports upside.
- The pair has spiked past 55-EMA and has broken above major trendline resistance at 74.90.
- Volatility is rising as suggested by widenning Bollinger Bands. Price action has edged above major EMAs.
- Next bull target lies at 200-DMA at 75.95 ahead of 76.30 (Aug 1 high).
- We see weakness only on retrace below 110-EMA at 74.67.
Support levels - 74.67 (110-EMA), 74.45 (23.6% Fib)
Resistance levels - 75.54 (21, 26th Sept), 75.81 (38.2% Fib)
Call update: Our previous call (https://www.econotimes.com/FxWirePro-NZD-JPY-Trade-Idea-1451943) has hit all targets.
Recommendation: Book partial profits, trail SL to 74.85, target 75.80/ 75.95
For details on FxWirePro's Currency Strength Index, visit http://www.fxwirepro.com/currencyindex.


