


 Trump’s "Shock and Awe" Agenda: Executive Orders from Day One
  Geopolitical Shocks That Could Reshape Financial Markets in 2025
  Energy Sector Outlook 2025: AI's Role and Market Dynamics
  UBS Projects Mixed Market Outlook for 2025 Amid Trump Policy Uncertainty
  Moody's Upgrades Argentina's Credit Rating Amid Economic Reforms
  FxWirePro: GBP/USD recovers but bears are not done yet again
  China’s Growth Faces Structural Challenges Amid Doubts Over Data
  Urban studies: Doing research when every city is different
  US Gas Market Poised for Supercycle: Bernstein Analysts
  U.S. Treasury Yields Expected to Decline Amid Cooling Economic Pressures
  Mexico's Undervalued Equity Market Offers Long-Term Investment Potential
  FxWirePro- Major Crypto levels and bias summary
  FxWirePro: USD/CAD runs out of steam but maintains bullish outlook
  Pound Under Pressure as Yen Stabilizes: GBPJPY Bears Target 208 as Key EMAs Hold Resistance
  Ethereum Retreats Toward USD 2,000: Technicals Signal Caution as ETH Mimics Bitcoin’s Pullback
  S&P 500 Relies on Tech for Growth in Q4 2024, Says Barclays
  FxWirePro: EUR/ NZD consolidating around 2.0180 room for further gains


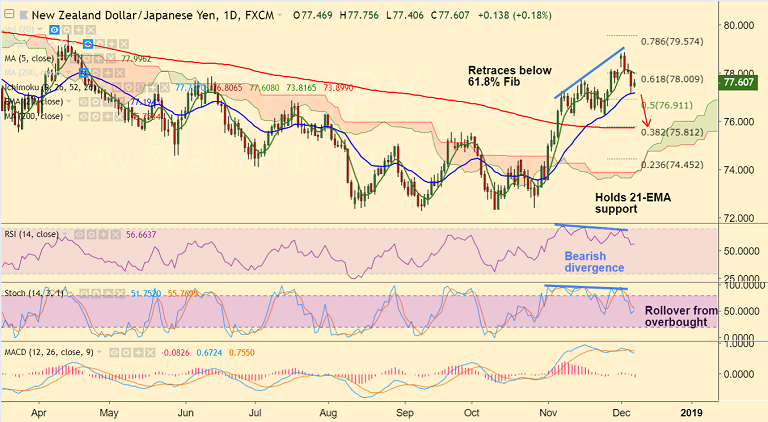
NZD/JPY chart on Trading View used for analysis
- NZD/JPY trades 0.17% higher on the day at 77.59 at the time of writing.
- The pair has held support at 21-EMA on Thursday's trade and edged higher.
- Break below 21-EMA will see weakness. Scope for dip till 200-DMA at 75.75.
- Technical studies on weekly charts is biased higher. But we see some weakness on the dailies.
- Price action has broken below 5-DMA and 5-DMA has turned. RSI and Stochs are biased lower after rollover from overbought levels.
- We see bearish divergence on RSI and Stochs which adds to the bearish bias.
Support levels - 77.19 (21-EMA), 76.26 (Nov 26 low), 75.75 (200-DMA)
Resistance levels - 78 (5-DMA), 78.86 (Dec 4 high), 79
Recommendation: Good to go short on break below 21-EMA, SL: 78, target 76.30/ 76/ 75.75
For details on FxWirePro's Currency Strength Index, visit http://www.fxwirepro.com/currencyindex.


