


 Pound Sterling Power: GBP/JPY Secures Third Day of Gains as Global Risk Tensions Recede
  Bitcoin’s Islamabad Watch: BTCUSD Consolidates Near 71,421 USD as Geopolitical Peace Talks Loom
  Bitcoin Breaks the $70,000 Barrier: Bulls Target the $80,000 Horizon as Geopolitical Relief Ignites Crypto Markets
  FxWirePro: EUR/AUD claws back some losses but rcovery likely muted
  FxWirePro: GBP/USD climbs to 4 -week high as ceasefire deal gives bulls traction
  FxWirePro: EUR/AUD falls below 1.6600 level, plunge to test a key fibo grows
  Kiwi Ascendant: NZDJPY Bulls Eye Multi-Year Peaks Amid Triple-Day Rally
  FxWirePro: GBP/AUD takes back some lost ground
  FxWirePro: EUR/NZD remains under pressure as key support gives way
  Pound on Pause: GBPJPY Bulls Regroup for a Potential Sprint Toward 215.00
  FxWirePro- Major European Indices
  FxWirePro: AUD/USD edged lower as early optimism over U.S.–Iran peace talks fade
  FxWirePro: USD/CNY falls to three-year high, scope for further downside
  Euro Ascendant: EUR/USD Breaks $1.17 as Geopolitical Relief Sparks a Bullish Surge
  Ethereum Reclaims Higher Ground: Ether Bulls Target $2,700 as Middle East Tensions Thaw
  NZD/JPY Rockets as Kiwi Dollar Resilience Defies the Oil Shock
  FxWirePro- Major Pair levels and bias summary


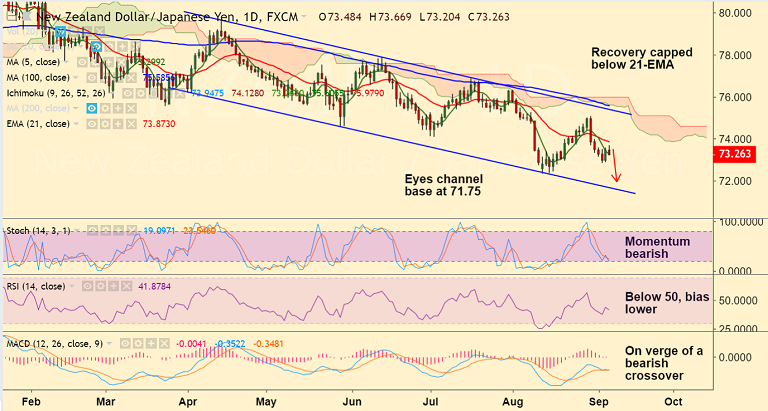
NZD/JPY chart on Trading View used for analysis
- NZD/JPY pauses recovery shy of 21-EMA at 73.86, momentum with the bears.
- Recovery attempts in the pair lack traction. Price has slipped from session highs at 73.66 and is currently trading at 73.24 levels.
- The pair trades in a downward channel and finds strong resistance at 55-EMA at 74.66. We see bearish invalidation only on break above.
- Kiwi remains weak in response to poor NZ data and growing conviction among markets that the next RBNZ policy move will be a cut - rather than a hike.
- Technicals support further weakness. Stochs and RSI are sharply lower and MACD is on verge of bearish crossover on signal line.
- We see scope for test of channel base at 71.75. Violation there could see major downside. Bearish invalidation only above 55-EMA.
Support levels - 73.29 (5-DMA), 73, 72.35 (Aug 13 low), 71.75 (channel base), 71
Resistance levels - 73.87 (21-EMA), 74.66 (55-EMA), 75
Call update: Our previous call (https://www.econotimes.com/FxWirePro-NZD-JPY-resumes-weakness-after-rejection-at-55-EMA-eyes-channel-base-at-7175-stay-short-1423201) has hit TP1.
Recommendation: Book partial profits at lows. Hold for further weakness.
FxWirePro Currency Strength Index: FxWirePro's Hourly NZD Spot Index was at -51.2661 (Neutral), while Hourly JPY Spot Index was at -72.5643 (Neutral) at 0700 GMT. For more details on FxWirePro's Currency Strength Index, visit http://www.fxwirepro.com/currencyindex.


