


 FxWirePro: GBP/NZD remains buoyant, looks to extend gains
  FxWirePro: GBP/USD recovers but bears are not done yet again
  FxWirePro: USD/ZAR sustains gains as uptrend remains strong
  FxWirePro- Major Pair levels and bias summary
  Bitcoin Battles Volatility: Institutional Support Eyes USD 64,000 Floor Amid Geopolitical Tensions
  FxWirePro- Woodies Pivot(Major)
  Euro Retreats as Geopolitical Tensions Surge: EURUSD Eyes 1.1400 Floor Amid Safe-Haven Demand
  FxWirePro: GBP/NZD range to extend until there is game changing news
  FxWirePro: USD/CNY gains some ground but bearish outlook persists
  Pound Under Pressure as Yen Stabilizes: GBPJPY Bears Target 208 as Key EMAs Hold Resistance
  FxWirePro: EUR/ NZD steadies around 2.0150, retains bid tone
  NZDJPY Bears Take Control: New Zealand Dollar Retreats as 92 Resistance Holds Firm
  FxWirePro: USD/ZAR fibo rejection triggers sizeable pullback
  FxWirePro:NZD/USD drifts lower, could be on verge of bigger drop
  FxWirePro: EUR/AUD eases slightly but trend is still bullish


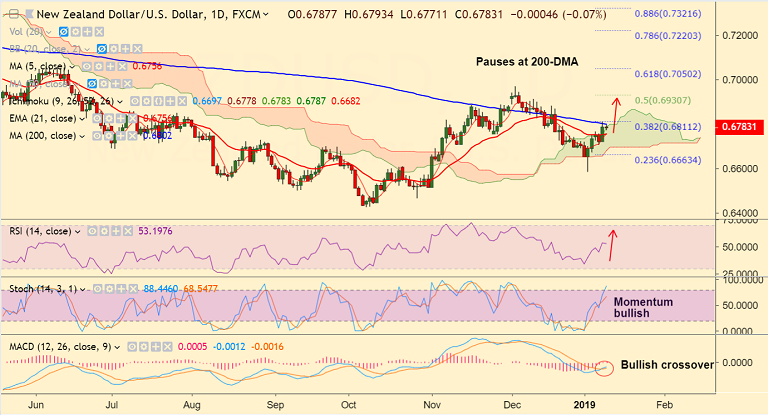
NZD/USD chart on Trading View used for analysis
- NZD/USD pauses upside at 200-DMA, break above to see further upside.
- Momentum studies are bullish. Stochs and RSI are biased higher.
- MACD is showing a bullish crossover on signal line which adds to the bullish bias.
- Break above 200-DMA will see test of 50% Fib at 0.6930 ahead of 0.6969 (Dec 4th high).
- On the flipside, rejection at 200-DMA will see dip till 5-DMA at 0.6755. Further weakness on brean below.
Support levels - 0.6755 (5-DMA), 0.67, 0.6663 (23.6% Fib)
Resistance levels - 0.6802 (200-DMA), 0.6930 (50% Fib)
For details on FxWirePro's Currency Strength Index, visit http://www.fxwirepro.com/currencyindex.


