


NZD/USD chart - Trading View
Spot Analysis:
NZD/USD was trading 0.74% higher on the day at 0.7013 at around 08:05 GMT
Previous Week's High/ Low: 0.6981/ 0.6876
Previous Session's High/ Low: 0.6968/ 0.6911
Fundamental Overview:
The risk-on mood acted as a tailwind for the perceived riskier kiwi amid a subdued USD demand.
The greenback reversed its gains to slip lower from 13-month tops following the release of US consumer inflation figures.
Headline US CPI for September rose 0.4%, pushing the yearly rate to 5.4%. The readings were slightly higher than market expectations, but USD bulls unimpressed.
Markets perceived the rise in inflation as transitory as reflected in the Fed's narrative, which was evident from a further decline in the longer-dated US Treasury bond yields, weighing on the USD.
That said, FOMC minutes showed that the Fed remains on track to begin tapering its bond purchases later this year, which could limit losses in USD.
Focus now on the release of US Producer Price Index (PPI) and the Weekly Initial Jobless Claims data later during the NY session for further impetus.
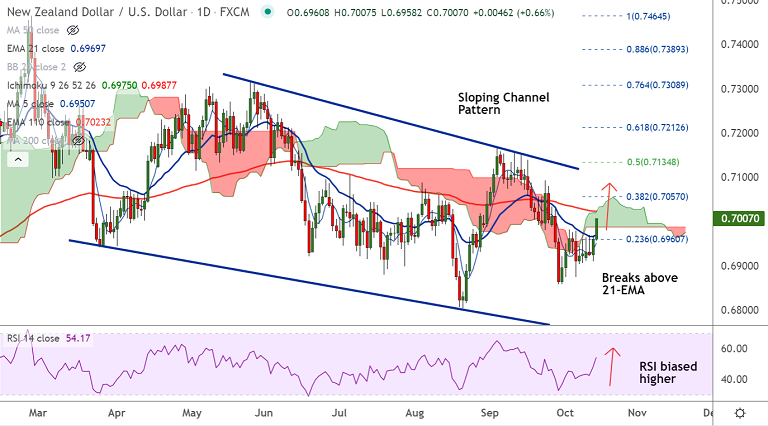
Technical Analysis:
- NZD/USD breaks above 21 and 55 EMA resistances
- Momentum studies are bullish, Stochs and RSI are biased higher
- Price action has entered into the daily cloud
- The pair has paused downside after Doji formation on previous week's candle
- GMMA indicator shows major and minor trend have turned bullish on the intraday charts
Major Support and Resistance Levels:
Support - 0.6998 (55-EMA), Resistance - 0.7023 (110-EMA)
Summary: NZD/USD trades with a bullish bias. Bulls eye immediate resistance at 0.7023. Break above will see gains till 38.2% Fib at 0.7057.


