


NZD/USD chart - Trading View
Spot Analysis:
NZD/USD was trading 0.15% higher on the day at 0.7112 at around 10:05 GMT
Previous Week's High/ Low: 0.7158/ 0.7075
Previous Session's High/ Low: 0.7118/ 0.7073
Fundamental Overview:
According to data released by Stats NZ on Thursday, Q2 GDP rose by 2.8% quarter-on-quarter, double the pace of growth in the Q1 2021.
Data compared to 1.4% quarter-on-quarter growth in Q1. GDP in the second quarter of 2021 was 4.3% higher than that in the fourth quarter of 2019.
With an outbreak of the Delta variant of Covid-19 plunging New Zealand into a lockdown since August, economists expect a contraction in Q3 GDP, followed by a revival in Q4.
Investors now look to the Fed’s latest policy decision, due to be handed down next week, for further timeline clues.
Technical Analysis:
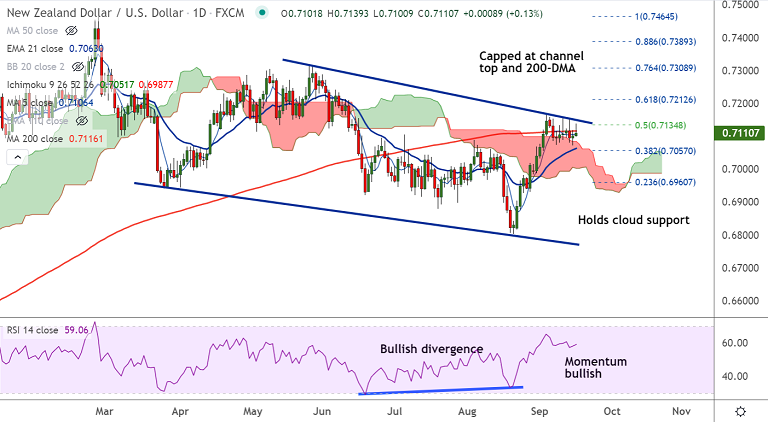
- Price action was rejected at channel top and has slipped below 200-DMA
- Downside has held support at daily cloud, breach below will drag the pair lower
- Momentum is bullish, RSI are biased higher and holds above the 50 mark. However, stochs have rolled over from overbought levels.
- GMMA shows minor trend is bullish, while major trend is turning bullish
Major Support and Resistance Levels:
Support - 0.7063 (21-EMA), Resistance - 0.7116 (200-DMA)
Summary: NZD/USD extends sideways grind, stiff resistance seen at 200-DMA and channel top. Decisive break above will fuel further gains. Upbeat New Zealand GDP data fails to impress amid concerns over global growth as disappointing China economic news.
Focus on US FOMC meeting for impetus. Decisive break above 200-DMA and channel top will buoy bulls in the pair. Retrace below cloud negates any further upside.


