


 FxWirePro: EUR/ NZD steadies around 2.0150, retains bid tone
  FxWirePro- Woodies Pivot(Major)
  Ethereum Retreats Toward USD 2,000: Technicals Signal Caution as ETH Mimics Bitcoin’s Pullback
  FxWirePro: EUR/AUD gaining momentum for a move towards 1.6800 level
  Pound Under Pressure as Yen Stabilizes: GBPJPY Bears Target 208 as Key EMAs Hold Resistance
  FxWirePro- Major European Indices
  FxWirePro- Major Crypto levels and bias summary
  FxWirePro: USD/JPY firms as Trump's address on Gulf war spark fresh concerns
  NZDJPY Bears Take Control: New Zealand Dollar Retreats as 92 Resistance Holds Firm
  EUR/JPY Bulls Charge: Eyeing 186.00 as Euro Strength Intensifies
  FxWirePro:NZD/USD drifts lower, could be on verge of bigger drop
  FxWirePro: GBP/NZD range to extend until there is game changing news
  Bitcoin Battles Volatility: Institutional Support Eyes USD 64,000 Floor Amid Geopolitical Tensions
  Euro Retreats as Geopolitical Tensions Surge: EURUSD Eyes 1.1400 Floor Amid Safe-Haven Demand
  FxWirePro: GBP/USD outlook weaker on renewed downside pressure
  FxWirePro: USD/ZAR fibo rejection triggers sizeable pullback
  FxWirePro- Major Crypto levels and bias summary


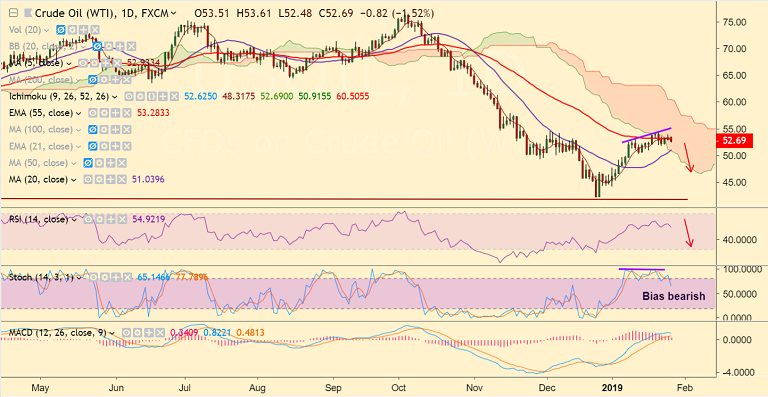
US Oil chart on Trading View used for analysis
- WTI starts the week on a bearish note, trades 1.85% lower on the day at 52.53.
- Baker Hughes data showed that of US oil rigs rose by 10 to 892 in the week ended Jan. 15 - the first weekly rise of 2019.
- US-China trade war, lower demand from Europe and the resulting slowdown in the global economy to add further pressure.
- Price is in a major downtrend and technical studies do not show any major signs of recovery.
- We see price action is extending sideways grind along 55-EMA resistance and break below 21-EMA could see further downside.
- We evidence slight bearish divergence on Stochastics which adds to the bearish bias.
Support levels - 52.22 (200-W SMA), 51.59 (21-EMA), 51.03 (20-DMA)
Resistance levels - 53.28 (55-EMA), 54.30 (Jan 22 high), 54.54 (Dec 4 high)
For details on FxWirePro's Currency Strength Index, visit http://www.fxwirepro.com/currencyindex.


