


 FxWirePro- Major European Indices
  FxWirePro- Woodies Pivot(Major)
  FxWirePro: AUD/USD recovers slightly from early decline but bears are not done yet
  FxWirePro: USD/JPY holds range near 160 as intervention risks loom
  FxWirePro:NZD/USD drifts lower, could be on verge of bigger drop
  Ethereum Retreats Toward USD 2,000: Technicals Signal Caution as ETH Mimics Bitcoin’s Pullback
  FxWirePro- Woodies Pivot(Major)
  FxWirePro: GBP/USD outlook weaker on renewed downside pressure
  FxWirePro- Major Crypto levels and bias summary
  FxWirePro: USD/JPY firms as Trump's address on Gulf war spark fresh concerns
  FxWirePro: GBP/NZD remains buoyant, looks to extend gains
  Bitcoin Resilience: BTC Reclaims USD 69,000 as Geopolitical Tensions Ease
  Aussie Ascent: AUDJPY Reclaims 110.00 as Bullish Momentum Ignites
  FxWirePro: USD/CNY gains some ground but bearish outlook persists
  Bitcoin Battles Volatility: Institutional Support Eyes USD 64,000 Floor Amid Geopolitical Tensions
  Pound Under Pressure as Yen Stabilizes: GBPJPY Bears Target 208 as Key EMAs Hold Resistance


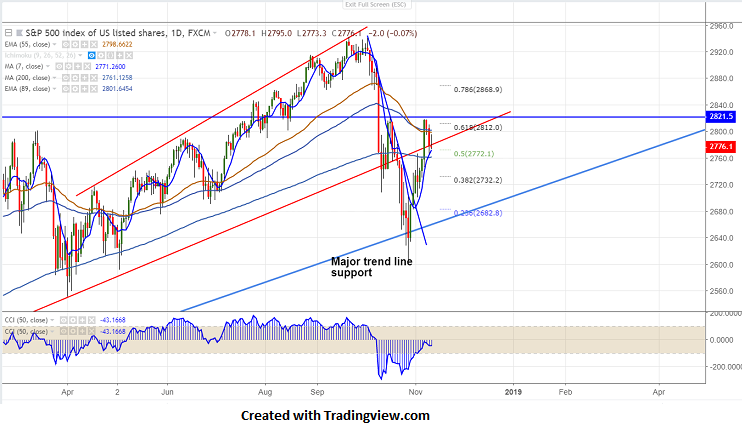
Short term trend Slightly bearish
Major resistance 2820
Chart pattern- Double top
S&P500 has declined almost more than 50 points after forming a double top around 2820.The index hits a low of 2763 and shown a minor jump . S&P500 has jumped more than 8% from low of 2603. The index has taken support near 200- day MA and any break below targets further weakness.It is currently trading at 2776 (0.06% lower).
The index’s near term resistance is around 2820 and any break above targets 2850/2900. Any break above 2821 confirms minor bullishness.
On the lower side, near term support is around 2761 (200- day MA) and any break below targets 2735/2700.
It is good to sell on rallies around 2795-2800 with SL around 2821 for the TP of 2845.


