


U.S. oil chart - Trading View
- U.S. oil is trading 0.52% higher on the day, at 59.25 at 0855 GMT.
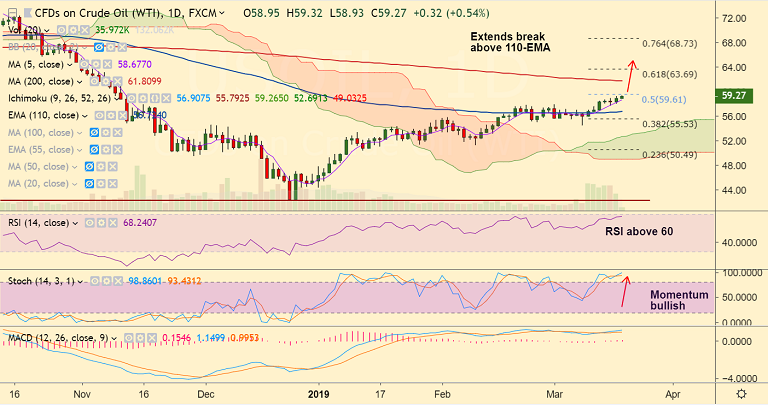
- Price nears 2019 highs as OPEC's extension of supply cuts keeps markets buoyed.
- OPEC on Monday canceled its planned meeting in April, thereby extending supply cuts first initiated in January.
- Price action has bounced off 55-EMA with a 'hammer' formation. We see weakness only below 55-EMA.
- Technical indicators have turned bullish. Decisive break above 110-EMA has raised scope for further gains.
- The pair eyes 50% Fib at 59.61. Close above 55-W EMA to see further upside.
- Focus now on the Energy Information Administration (EIA) US inventory data scheduled for release in the US session.
- Bullish momentum may stall if the US oil output continues to surge and the EIA reports a big US inventory build up.
Support levels - 58.68 (5-DMA), 56.72 (110-EMA), 55.53 (38.2% Fib)
Resistance levels - 59.61 (50% Fib), 60, 61.97 (200-DMA)
For details on FxWirePro's Currency Strength Index, visit http://www.fxwirepro.com/currencyindex.


