


 FxWirePro: USD/JPY firms as Trump's address on Gulf war spark fresh concerns
  FxWirePro: GBP/NZD range to extend until there is game changing news
  FxWirePro- Major Pair levels and bias summary
  FxWirePro: EUR/ NZD steadies around 2.0150, retains bid tone
  EUR/JPY Bulls Charge: Eyeing 186.00 as Euro Strength Intensifies
  FxWirePro: GBP/NZD remains buoyant, looks to extend gains
  FxWirePro: GBP/USD outlook weaker on renewed downside pressure
  FxWirePro:NZD/USD drifts lower, could be on verge of bigger drop
  FxWirePro: USD/ZAR sustains gains as uptrend remains strong
  Pound Under Pressure as Yen Stabilizes: GBPJPY Bears Target 208 as Key EMAs Hold Resistance
  FxWirePro- Woodies Pivot(Major)
  FxWirePro- Major Pair levels and bias summary
  FxWirePro: USD/ZAR fibo rejection triggers sizeable pullback
  FxWirePro: USD/CNY gains some ground but bearish outlook persists
  FxWirePro- Major Crypto levels and bias summary
  FxWirePro: EUR/AUD gaining momentum for a move towards 1.6800 level


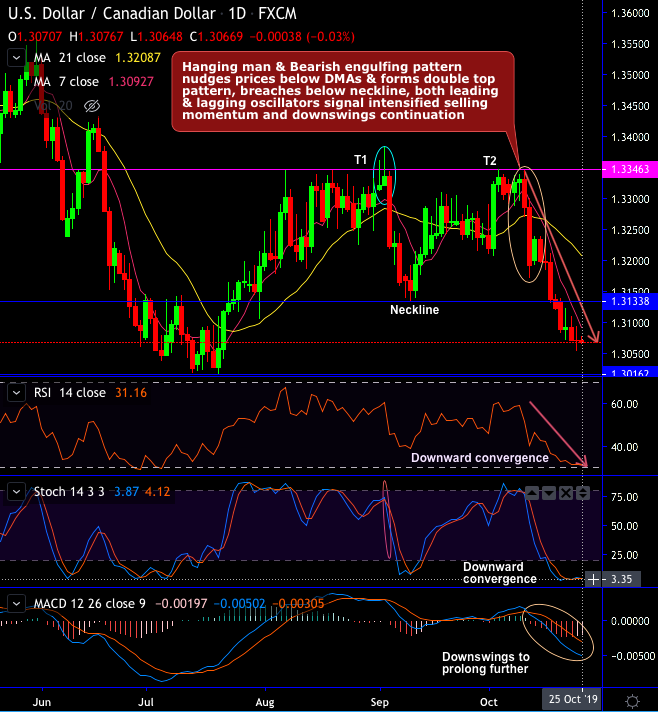
Technical Chart and Candlestick Patterns: Both USDCAD minor and major trends have been edgy.
Hanging man followed by bearish engulfing pattern at peaks of rallies (at 1.3331 and 1.3285 levels respectively) forms double top pattern to nudge prices below DMAs. Consequently, breaches below neckline at 1.3133 (refer daily plotting).
While both leading and lagging oscillators, on this timeframe, signal the intensified selling momentum and the downswings continuation.
On a broader perspective, the major uptrend spikes through uptrend line (refer monthly chart), the current price attempts to slide below 7 & 21-EMAs as both momentum oscillators signal overbought pressures and the trend indicators are indecisive on this timeframe.
In addition, Dragonfly doji occurred at – 1.2463 (on monthly), and at 1.3241 (on daily) and bearish engulfing at – 1.3123 and 1.3086 levels (on monthly), at 1.3327 levels counters major uptrend.
Hence, there has been the tight tussle between bulls and bears, since the leading indicators signaling overbought pressures, the major uptrend appears to be exhausted at this juncture. It may prolong further if it manages to hold support of uptrend line.
Trade Tips: On trading perspective, at spot reference: 1.3067 levels, we, on hedging grounds, advocate shorts in futures of November’19 delivery, contemplating above technical factors, Fed and BoC’s monetary policy that is scheduled for this week.


