


 FxWirePro: EUR/ NZD under pressure after early buying dries up
  FxWirePro: USD/ZAR gains upside momentum as bulls take charge
  FxWirePro: USD/ZAR slips as rand gains on peace talk hopes
  NZDJPY Dip-Buy Setup: 93.58 Holds as Bulls Eye 95–96
  FxWirePro: GBP/USD gains on upbeat UK retail sales data
  FxWirePro: USD/ JPY remains buoyant, looks to extend gains
  FxWirePro-Major European Indices
  FxWirePro- Major Pair levels and bias summary
  FxWirePro: GBP/NZD downtrend loses momentum but bearish setup remains
  ETHUSD Dips to 2285 Then Rebounds on $150–$200M ETF Inflows and Altcoin Upside
  FxWirePro: EUR/AUD tight ranges prevail as market waits for fresh catalyst
  FxWirePro: GBP/NZD continues to recovers , upside pressure builds
  FxWirePro- Major Pair levels and bias summary
  FxWirePro: AUD/USD nurses losses in subdued trading
  Bitcoin Flat Near 77k as US-Iran Tensions Escalate; ETF Inflows Near $1B for the Week
  Euro Stabilizes Near 1.1713 as IFO Weakness Meets Oil Volatility; 1.1800 in Focus


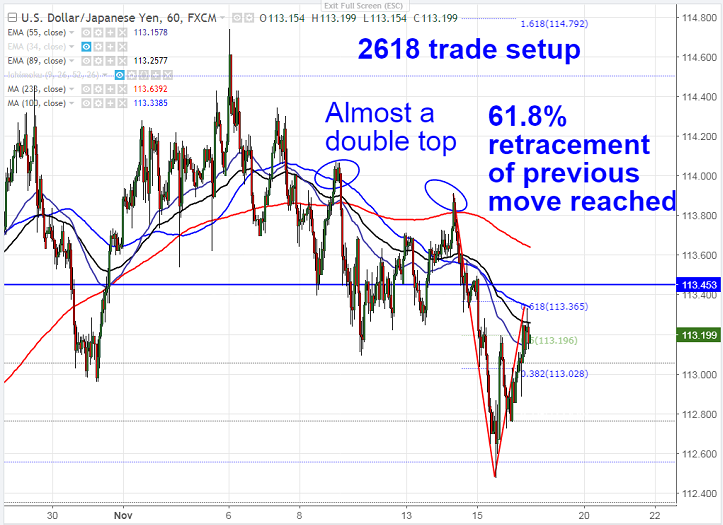
- Major resistance – 113.36 (61.8% retracement of 113.91 and 112.48).
- USD/JPY has retraced after hitting low of 112.48. The pair formed temporary top around 114.73 and is declining from that level. It is currently trading around 113.18.
- In the hourly chart, the pair has formed 2618 chart pattern. The pair jumped till 113.32 almost near to 61.8% retracement of 113.91 and 112.48 and showing minor selling from that level. The near term resistance is around 113.36 and any break above will take the pair to next level till 113.87/114.45. It should break above 114.73 for the further bullishness.
- On the lower side, near term support is around 112.95 and any break below will drag the pair down till 112.48/112.20.
It is good to sell on rallies around 113.36 with SL around 113.87 for the TP of 112.48/112.20.


