


 Bitcoin Battles Volatility: Institutional Support Eyes USD 64,000 Floor Amid Geopolitical Tensions
  FxWirePro: USD/CAD runs out of steam but maintains bullish outlook
  Aussie Retreats Against the Yen: AUDJPY Bears Target 108 as 110 Resistance Holds Firm
  FxWirePro- Woodies Pivot(Major)
  FxWirePro- Major Pair levels and bias summary
  Ethereum Retreats Toward USD 2,000: Technicals Signal Caution as ETH Mimics Bitcoin’s Pullback
  FxWirePro: EUR/ NZD steadies around 2.0150, retains bid tone
  FxWirePro: GBP/USD outlook weaker on renewed downside pressure
  FxWirePro: GBP/USD recovers but bears are not done yet again
  FxWirePro: USD/CNY gains some ground but bearish outlook persists
  FxWirePro: USD/ZAR fibo rejection triggers sizeable pullback
  FxWirePro: GBP/NZD remains buoyant, looks to extend gains
  FxWirePro: GBP/NZD range to extend until there is game changing news
  NZDJPY Bears Take Control: New Zealand Dollar Retreats as 92 Resistance Holds Firm
  FxWirePro- Major Crypto levels and bias summary
  EUR/JPY Bulls Charge: Eyeing 186.00 as Euro Strength Intensifies
  FxWirePro: USD/JPY firms as Trump's address on Gulf war spark fresh concerns


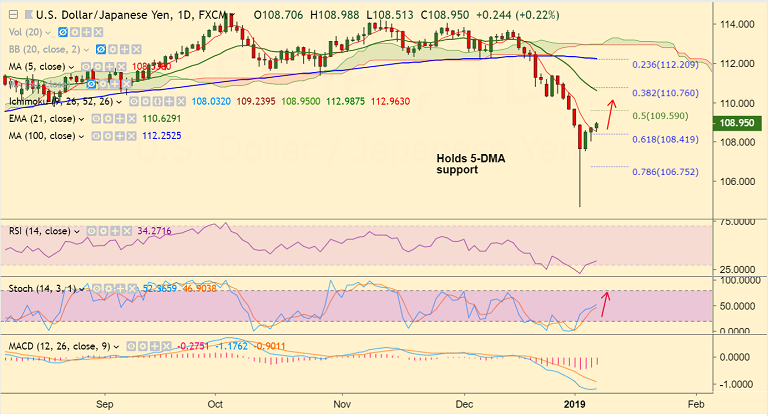
USD/JPY chart on Trading View used for analysis
- USD/JPY edges higher for the 3rd straight session, trades at 108.95 at 0420 GMT.
- Intraday bias is higher. Technical studies on the daily charts are turning slightly bullish.
- Stochs and RSI have rolled over from oversold levels and are biased higher.
- The pair has broken above 5-DMA which is now immediate support at 108.53.
- Next immediate resistance lies at 1H 200 SMA at 109.48. Violation there could see further upside.
- On the flipside, break below 5-DMA will see resumption of weakness.
Support levels - 108.53 (5-DMA), 108.41 (61.8% Fib), 108
Resistance levels - 109.48 (1H 200 SMA), 109.59 (50% Fib), 110
Recommendation: Good to go long on upticks at 108.85/90, SL: 108.50, TP: 109.45/ 109.60/ 110
For details on FxWirePro's Currency Strength Index, visit http://www.fxwirepro.com/currencyindex.


