


USD/JPY chart - Trading View
Spot Analysis:
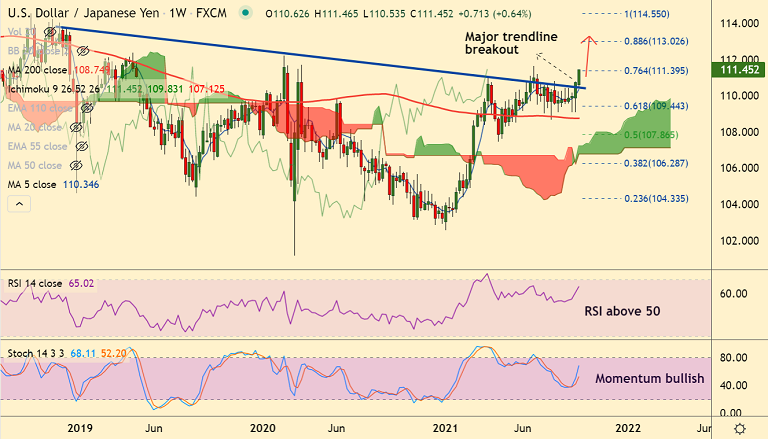
USD/JPY was trading 0.37% higher on the day at 111.39, outlook bullish
Previous Week's High/ Low: 110.79/ 109.12
Previous Session's High/ Low: 111.06/ 110.53
Fundamental Overview:
US dollar boosted on surging US Treasury yields after the Fed last week hinted that it will soon taper its asset purchases.
Investors now look forward to Fed Chair Jerome Powell’s testimony for fresh trading insights.
US Debt Limit looms. The House of Representatives are set to vote on a $1 trillion infrastructure bill this week.
The Sept. 30 deadline on funding federal agencies has the potential to force the second partial government shutdown in three years.
Technical Analysis:
- USD/JPY above cloud and major moving averages are trendline higher
- MACD confirms bullish crossover on signal line and ADX supports gains
- Momentum is bullish, Stochs and RSI are biased higher, volatility is high and rising
- Price action is above major moving averages and GMMA indicator shows minor trend is bullish
Major Support and Resistance Levels:
Support - 110.64 (5-DMA), Resistance - 113.02 (88.6% Fib)
Summary: USD/JPY extends bull run for the 5th straight session, bias is strongly bullish. Hawkish Fed speak to drive further gains. Scope for test of 113 levels.


