


 China's Refining Industry Faces Major Shakeup Amid Challenges
  FxWirePro: AUD/USD recovers slightly from early decline but bears are not done yet
  FxWirePro: EUR/AUD gaining momentum for a move towards 1.6800 level
  Global Markets React to Strong U.S. Jobs Data and Rising Yields
  FxWirePro- Major Crypto levels and bias summary
  Stock Futures Dip as Investors Await Key Payrolls Data
  Indonesia Surprises Markets with Interest Rate Cut Amid Currency Pressure
  Ethereum Retreats Toward USD 2,000: Technicals Signal Caution as ETH Mimics Bitcoin’s Pullback
  Moody's Upgrades Argentina's Credit Rating Amid Economic Reforms
  US Gas Market Poised for Supercycle: Bernstein Analysts
  FxWirePro:NZD/USD remains vulnerable as Trump's latest deadline leaves investors on edge
  FxWirePro: USD/CNY gains some ground but bearish outlook persists
  Energy Sector Outlook 2025: AI's Role and Market Dynamics
  FxWirePro: USD/ZAR sustains gains as uptrend remains strong
  FxWirePro: USD/CAD runs out of steam but maintains bullish outlook
  S&P 500 Relies on Tech for Growth in Q4 2024, Says Barclays


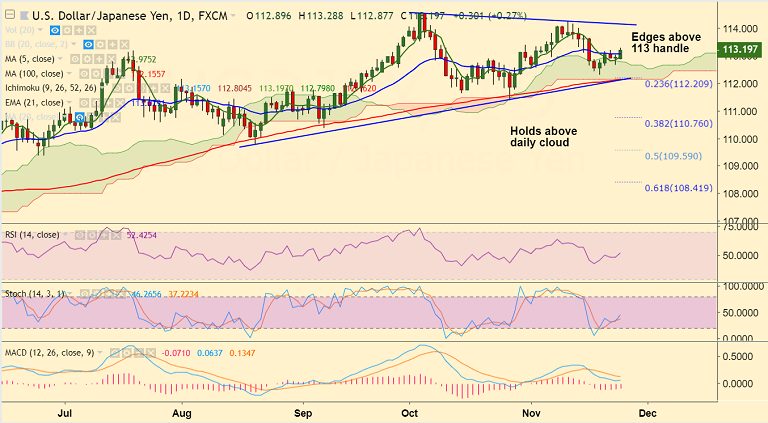
USD/JPY chart on Trading View used for analysis
- USD/JPY has broken above 113 handle and is currently trading at 113.21 after hitting session highs at 113.28.
- Rise in in the S&P 500 futures amid risk-on weighing on the Japanese yen.
- Technical studies are turning slightly bullish on the daily charts raising scope for further upside.
- The pair has broken above 21-EMA and has bounced off daily cloud on Friday's trade with a 'Dragonfly Doji' formation.
- RSI has edged above 50 mark and is biased higher along with Stochs.
- Close above 20-DMA to see test of upper Bollinger Band at 114 mark.
- Rejection at 21-EMA and slip below daily cloud to see weakness till 100-DMA.
Support levels - 113.08 (21-EMA), 112.30 (Nov 20th low)
Resistance levels - 113.38 (Oct 31 high), 114 (Upper BB)
For details on FxWirePro's Currency Strength Index, visit http://www.fxwirepro.com/currencyindex.


