


 FxWirePro:NZD/USD drifts lower, could be on verge of bigger drop
  Goldman Predicts 50% Odds of 10% U.S. Tariff on Copper by Q1 Close
  Moldova Criticizes Russia Amid Transdniestria Energy Crisis
  FxWirePro: GBP/USD outlook weaker on renewed downside pressure
  China’s Growth Faces Structural Challenges Amid Doubts Over Data
  EUR/JPY Bulls Charge: Eyeing 186.00 as Euro Strength Intensifies
  Gold Prices Slide as Rate Cut Prospects Diminish; Copper Gains on China Stimulus Hopes
  NZDJPY Bears Take Control: New Zealand Dollar Retreats as 92 Resistance Holds Firm
  Pound Under Pressure as Yen Stabilizes: GBPJPY Bears Target 208 as Key EMAs Hold Resistance
  FxWirePro: USD/ZAR sustains gains as uptrend remains strong
  S&P 500 Relies on Tech for Growth in Q4 2024, Says Barclays
  Ethereum Retreats Toward USD 2,000: Technicals Signal Caution as ETH Mimics Bitcoin’s Pullback
  FxWirePro: USD/CAD runs out of steam but maintains bullish outlook
  Wall Street Analysts Weigh in on Latest NFP Data
  U.S. Stocks vs. Bonds: Are Diverging Valuations Signaling a Shift?
  FxWirePro: GBP/NZD remains buoyant, looks to extend gains


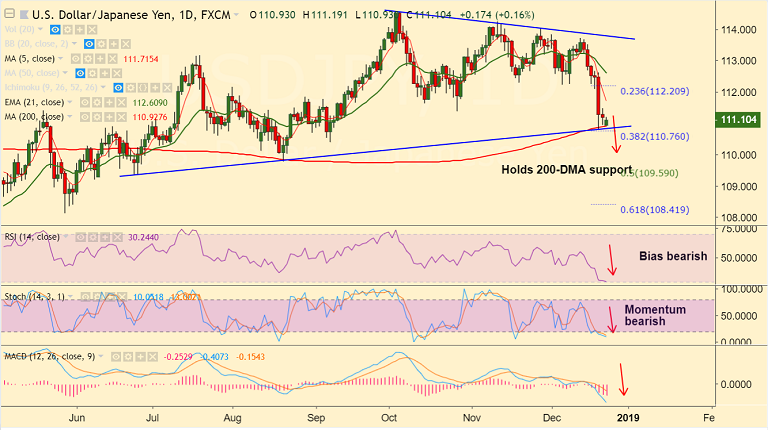
USD/JPY chart on Trading View used for analysis
- USD/JPY is showing a sluggish recovery in the Asian trade today, trades 0.09% higher on the day at 111.10 at the time of writing.
- The major has found major support at 200-DMA and we see weakness only on break below.
- Momentum indicators are strongly bearish and we do not see major signs of reversal.
- Stochs are at oversold territory and price action has been raging outside the Lower BB. We could see minor bounce at current levels.
- That said, a far less hawkish Fed and a flight to safety as global stocks extend downside will continue to support downside.
- Decisive break below 200-DMA will see next major support at 110.30 (Lower BB) and the 109.59 (50% Fib).
- Bounce off 200-DMA could see upside till 21-EMA at 112.60. Bearish invalidation likely above 113.80 (Triangle top).
Support levels - 110.92 (200-DMA), 110.30 (Lower BB), 109.59 (50% Fib)
Resistance levels - 111.71 (5-DMA), 112, 112.20 (23.6% Fib)
For details on FxWirePro's Currency Strength Index, visit http://www.fxwirepro.com/currencyindex.


