


 FxWirePro: USD/CAD extends decline on broad dollar weakness
  FxWirePro- Woodies Pivot(Major)
  FxWirePro: USD/CAD recovers slightly but bearish outlook persists
  FxWirePro: USD/JPY holding bid into weekend
  Bitcoin’s Volatile Reset: ETFs Rebound as Bulls Eye USD 80,000 Milestone
  FxWirePro- Major Crypto levels and bias summary
  FxWirePro: AUD/USD retreats slightly but trend is still bullish
  FxWirePro: USD/ZAR recovers slightly but trend is still bearish
  FxWirePro: GBP/AUD gains some upside momentum but still bearish
  FxWirePro: EUR/AUD downtrend loses steam but outlook still bearish
  FxWirePro- Major Pair levels and bias summary
  FxWirePro- Woodies Pivot(Major)
  FxWirePro: EUR/AUD under pressure as key support gives way
  Energy Surge Ignites US Inflation: USDCHF Eyes Support Amid Dollar Sell-Off
  FxWirePro: USD/ZAR edges lower ,investors remain on edge
  FxWirePro:NZD/USD uptrend loses momentum but bullish setup remains


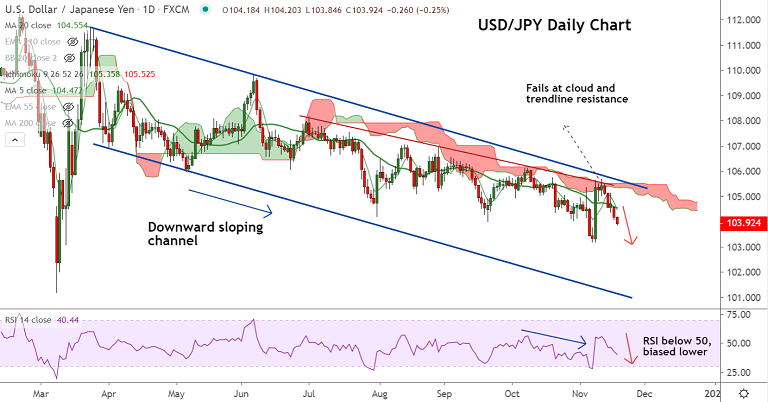
USD/JPY chart - Trading View
Technical Analysis: Bias Strongly Bearish
- USD/JPY extends weakness after rejection at daily cloud, slumps below 104 handle
- MACD shows bearish crossover on signal line, 5-DMA confirms bearish crossover on 20-DMA
- Momentum strongly bearish. Stochs and RSI are biased lower, RSI well below 50 mark
- Volatility is high and rising as evidenced by widening Bollinger bands
- Analysis of GMMA indicator shows major and minor trend are strongly bearish
Support levels - 103.47 (Lower BB), 103.17 (Nov 6th low), 103
Resistance levels - 104.46 (5-DMA), 104.64 (200H MA), 105.11 (55 EMA)
Summary: USD/JPY has dived below the 104 handle. Technical indicators show scope for further weakness. Price action has slipped below the 200-month MA at 103.92, close below for the week will open downside for the pair. Scope for test of 101.65 (Major trendline support).


