


 FxWirePro: AUD/USD downside pressure builds, key support level in focus
  FxWirePro: USD/ZAR fibo rejection triggers sizeable pullback
  FxWirePro: GBP/USD recovers but bears are not done yet again
  FxWirePro: USD/CNY gains some ground but bearish outlook persists
  Pound Under Pressure as Yen Stabilizes: GBPJPY Bears Target 208 as Key EMAs Hold Resistance
  FxWirePro: GBP/USD outlook weaker on renewed downside pressure
  FxWirePro: EUR/ NZD consolidating around 2.0180 room for further gains
  Aussie Retreats Against the Yen: AUDJPY Bears Target 108 as 110 Resistance Holds Firm
  EUR/JPY Bulls Charge: Eyeing 186.00 as Euro Strength Intensifies
  FxWirePro: USD/CAD runs out of steam but maintains bullish outlook
  FxWirePro: EUR/AUD gaining momentum for a move towards 1.6800 level
  Euro Retreats as Geopolitical Tensions Surge: EURUSD Eyes 1.1400 Floor Amid Safe-Haven Demand
  FxWirePro: USD/ZAR sustains gains as uptrend remains strong
  Ethereum Retreats Toward USD 2,000: Technicals Signal Caution as ETH Mimics Bitcoin’s Pullback
  FxWirePro: GBP/NZD remains buoyant, looks to extend gains
  Bitcoin Battles Volatility: Institutional Support Eyes USD 64,000 Floor Amid Geopolitical Tensions
  FxWirePro- Major European Indices


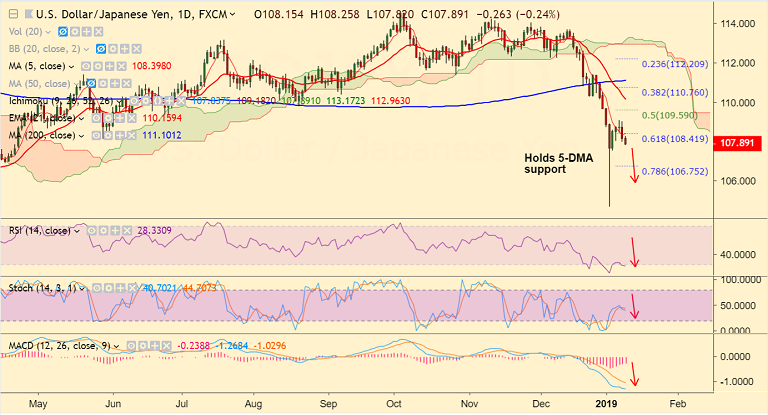
USD/JPY chart on Trading View used for analysis
- USD/JPY slips below 108 handle as US dollar succumbs to pressure amid negative equities and US Treasury yields.
- Risk aversion in the US stock futures and the resulting haven demand for the Japanese yen weighing on the pair.
- FOMC minutes overnight continue to represent the Fed's caution in raising rate.
- Also, US-China trade negotiations failed to produce a breakthrough deal.
- The pair is trading 0.30% lower on the day at 107.84 at 0400 GMT, bias lower.
- Price action has slipped below 5-DMA and is on track to test 78.6% Fib at 106.75.
- Momentum is bearish. Stochs have turned lower. MACD supports weakness.
- We see little support till 106.75 which is nearly converged 78.6% Fib and lower Bollinger Band.
- On the flipside, 5-DMA is immediate resistance at 108.40, decisive break above could see minor upside.
Support levels - 107, 106.75 (nearly converged 78.6% Fib and lower Bollinger Band)
Resistance levels - 108.40 (5-DMA), 109
For details on FxWirePro's Currency Strength Index, visit http://www.fxwirepro.com/currencyindex.


